[Heikin-Ashi Trading Strategy]-Steemit Crypto Academy | S4W2 | Homework Post for @reddileep
Define Heikin-Ashi Technique in your own words.
The Heikin Ashi chart provides a deep and clear view of a particular market, you can use it when making trades that require exact buy entry and sell. It is very useful because it makes candlestick charts more readable and also the trends are easier to analyze. For instance traders can use high Heikin charts to know when to stay in trades while a trend continues and also exit the market when the trend stops or reverses.
Remember that the Heikin Ashi candles are calculated differently and they provide us with information that's not similar to the one we can read on a normal candlestick chart. The Heikin Ashi is a charting technique that can be used to read price action and forecast future prices. Compared to the candlestick chart, the Heikin Ashy chart is attempting to remove some of a particular market noise to better seize the market trend.
Simply put, Heikin Ashy is have a special way of displaying the price on our charts. Heikin Ashi has a smoother look because it's essentially an average of the movement. The Heikin can remain red in the period of trend and green during an uptrend.

Make your own research and differentiate between the traditional candlestick chart and the Heikin-Ashi chart. (Screenshots required from both chart patterns)
| Heikin Ashi Chart | Tradition Chart |
|---|---|
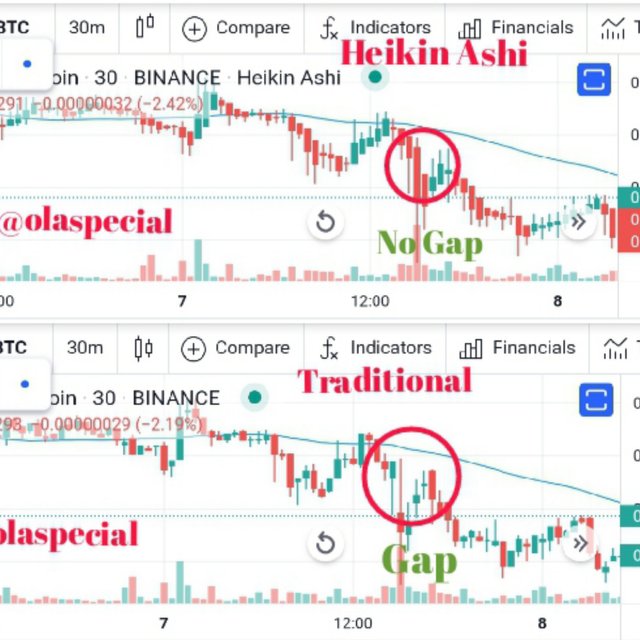
| The Heikin-Ashi chart don't show the gaps in the market and some price data. | The traditional chart show the gaps and right price data. |
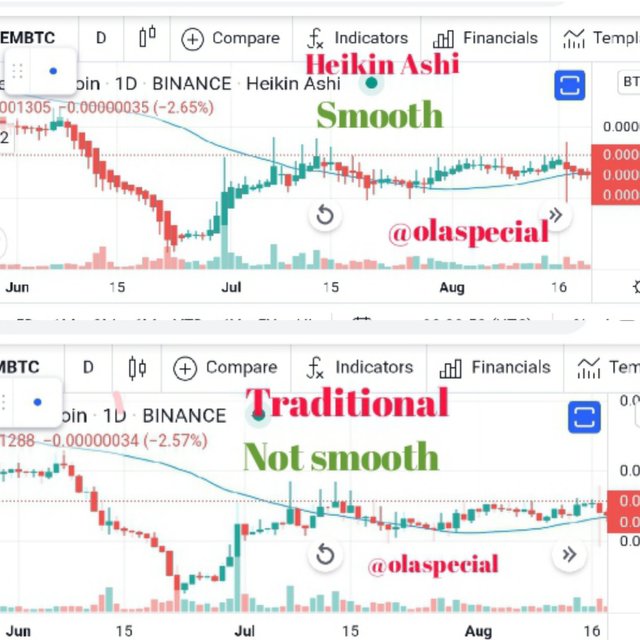
| With the Heikin-Ashi bars, it much more smoother. | Traditional bars are not smooth. |
| Heikin-Ashi candlesticks reduces the noise on the chart and allows them to display the trends more clearly. | Traditional candlesticks are displayed is term the current bullish and bearish which makes it noisy. |
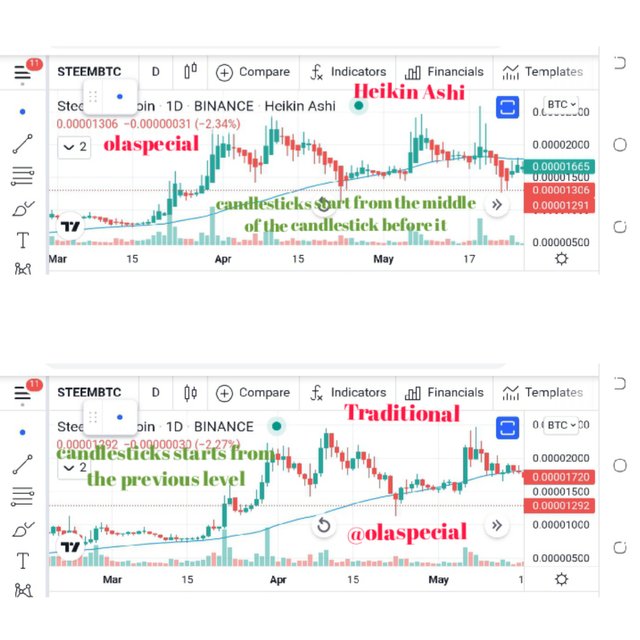
| The candlesticks always start from the middle of the candlestick before it. | If you are to look at the traditional candlesticks you will see that most of the time starts from the level where the previous candlestick had closed. |
| Heikin-Ashi bar have three main price action patterns which are bullish bars, bearish bars, and indecision bars | Traditional have tons candlestick patterns. |
Explain the Heikin-Ashi Formula. (In addition to simply stating the formula, you should provide a clear explanation about the calculation)
Open: Average of previous's open and close
When we look at the open price of the Heikin-Ashi candlestick, this is where it looks at candlestick. So, the open price of the current Heikin-Ashi is based on an average of the open and close of the previous candlesticks. So, it's a calculation based on what when on before.
Close: Average open, high, low, close.
It is dependent on the open high low close of the current period. So, it does not just take the closing price.
High: High, or open, or close.
It actually can be the high traded in the session but if the open or the closed was higher then that's the level said as the high.
Low: Low, or open, or close.
It can be the low traded but if the open on the close is the low then that's the low.
Heikin Close is an arithmetic mean the average of the open high and low and close of the period in question. So we add those together and divide by 4.
C=1/4(0+H+L+C)
Heikin an high is the maximum of either the high or the open or the close of the current period whichever is the biggest of the three.
H=MAX(H, O or C)
The Heikin low is the minimum of the current low open or close whichever is the lowest of those three.
L=Min(L, O or C)
Then the Heikin open is actually an average and arithmetic mean of the previous periods open and close we are those together and divide by two.
O=1/2(O + C)
Graphically explain trends and buying opportunities through Heikin-Ashi Candles. (Screenshots required)
You can that the price has spiked up pretty quickly and then started consolidating. Consolidation in an uptrend is a good sign because this could mean that price can go up further and market did bounce off.
When the market is moving in an uptrend, you can see there's a little or rare lower shadow on the chart. So, it's a way of identifying trends and even much easier to follow the trend. The Doji is good identified buy signal because suggest sentiment is shifting in the market.
Is it possible to transact only with signals received using the Heikin-Ashi Technique? Explain the reasons for your answer.
It is possible to use Heikin-Ashi only with signals. Heikin-Ashi is a trend following tool and This help to identify the trend of the market. The Doji is good identified buy or sell signal because it suggest sentiment is shifting in the market.
But trading only with the Heikin-Ashi technique is not a good idea because the price is not always where the current market price is. Is are to look at the lower time frame such as the 5min, you will discover that it is not where the price is present. If you were to go to faster time frame, you are going to notice that there's going to be a discrepancy between where the Heikin-Ashi closes at currently and where the price is actually trading. You will see how dangerous it is to use Heikin-Ashi only as a chart style that you would use for an entry and exit.
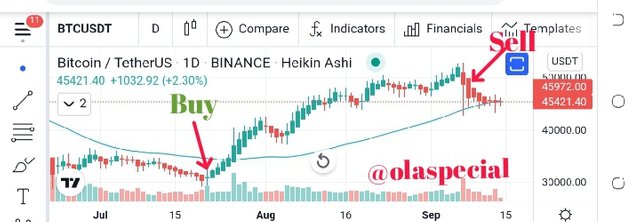
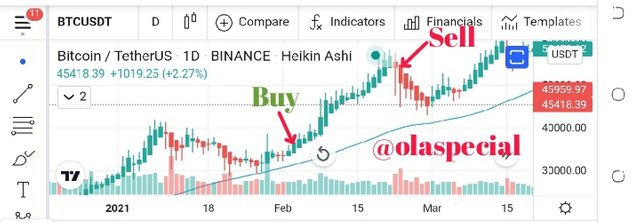
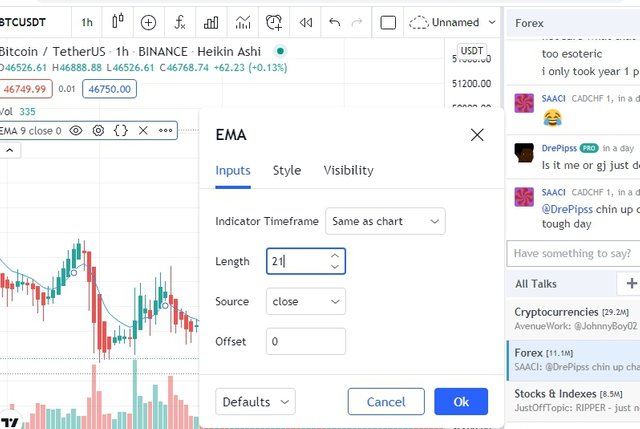
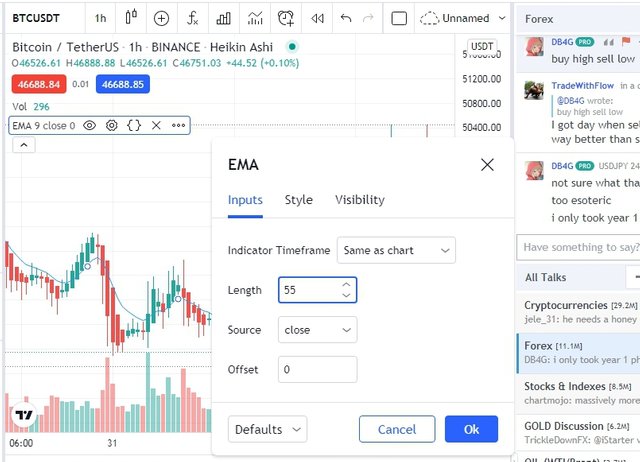
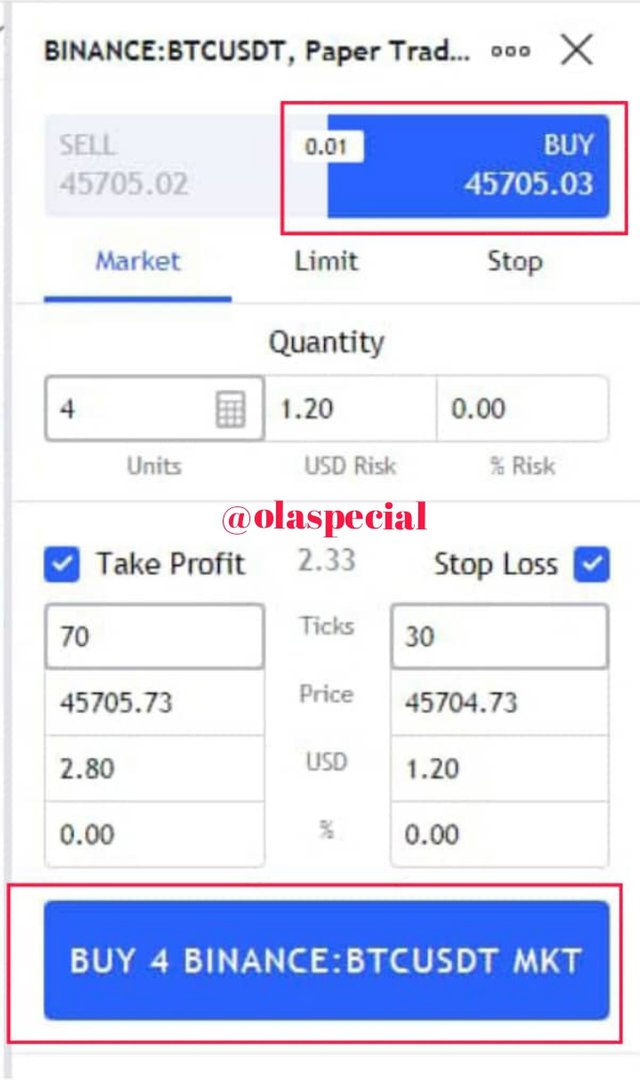
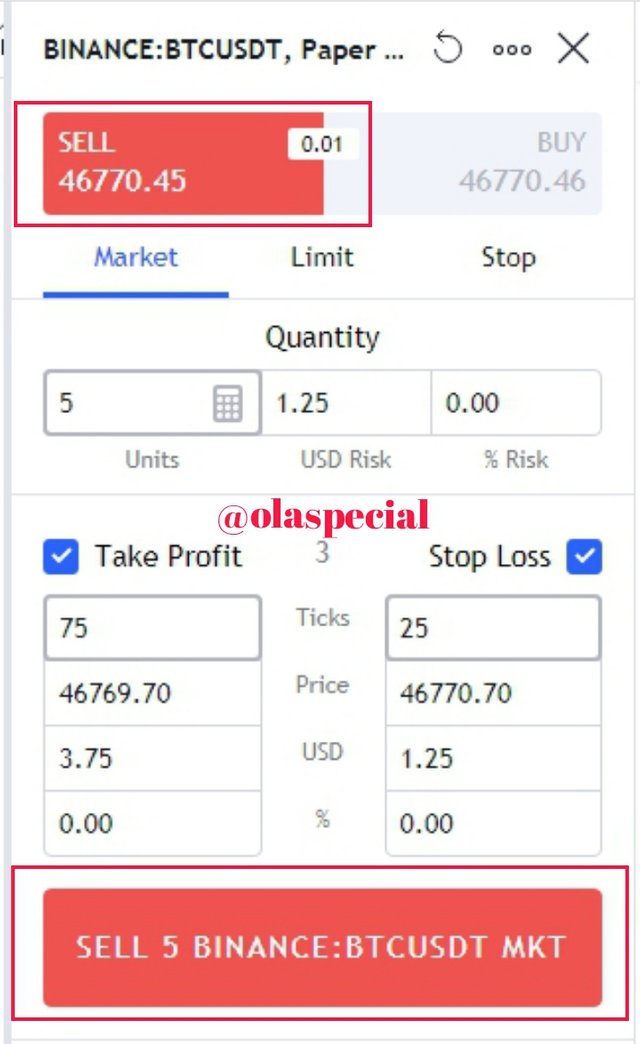
By using a Demo account, perform both Buy and Sell orders using Heikin-Ashi+ 55 EMA+21 EMA.
I will like to Biy and Sell Heikin Ashi candle signal in addiction with +55 EMA + 21 EMA. Firstly, we will set our EMA length to 55 and also 21
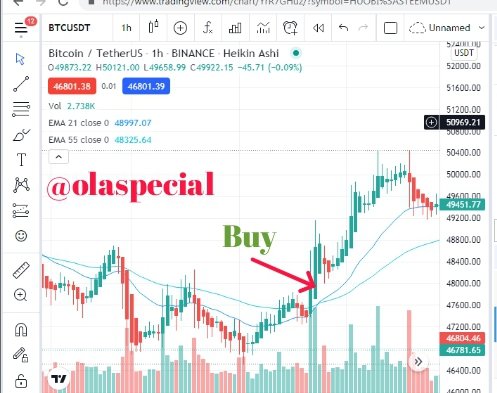
Buy
As you can see on the chart below that when the 21 EMA crosse the 55 EMA that is a buy signal
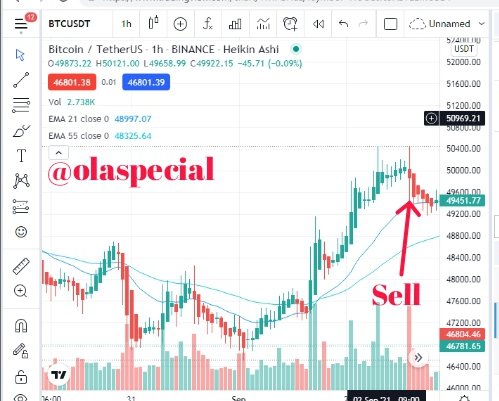
Sell
As you can see on the chart below, when we have bearish Doji after a bullish trend, it a signal of bearish trend.
Conclusion
Heikin Ashi is good for swing trader because swing traders are look for long term position in a trend. Heikin Ashi candles are very good but as good as it is, it's very dangerous for scalpers because the candlesticks display the average pace of the price movement. That one the main reasons you shouldn't use for scalp because the price moves up and down it does not display it firmly on this candlesticks and you could go into a huge draw down. Especially if you are in a short term position, you do not want that type of a draw down.
Thank you professor @reddileep for the wonderful lecture.
Deleted
@reddileep, I read the requirements before attempting the homework.
Cc:
@steemcurator1
@steemcurator2
Sorry for the inconvenience, I will change the review.