Crypto Academy Season 4 | Week 1: Trading with Strong, Weak and Gap Levels | for @allbert olaspecial

Graphically, explain the difference between Weak and Strong Levels. (Screenshots required) Explain what happens in the market for these differences to occur.


Some people are on burning this campsite saying as soon as support is hammered it more times it's touched it means that a more likely it's gonna break. This like a battering ram hitting it weakening the wall and eventually that wall will break. The other side of the camp. You've got guys who say no no every time support such the more it holds the stronger it becomes. It means that it's a stronger support. Means that more people are dealing at that level in it counter-trend environment and a counter-trend position and it's going to hold.
Weak and Strong level
The market decided that there was no distinct value or buyers didn't perceive that as good enough value to step. You had the combination of seller still thinking that was good value for them but buyers not really and no one on the other side really stepping up to the plate and driving higher or driving it lower.
This is a weak support because the amount of times the market is spent near that support level. If the market has sitting near the support level or resistance level the likelihood of it breaking through is higher than if it's bouncing off clean.
There some factors that lead to weak and strong level of support. The difference occur because of the downward pressure because of the fact that buyers are that keen on it, They're not stepping up that aggressively but you will see that support break.

Explain what a Gap is. (Required Screenshots) What happens in the market to cause It.
Gaps usually happen between day today. A gap is where no trades took place between one moment to the next and it happens fairly frequent on inner day charts from one day to the next and less comment on weekly charts or even monthly charts. The reason for that is is because things on a day-to-day basis from one day to the next, things like an earnings report or the psychology can come out something within the fundamental of the market can change from one day to the next. That's why there could be some risk if you're a swing trader versus a day trader. Now, it can be great if you're on the right side of the trade.

As far as weekly charts are concerned or on a longer-term charts they can also have gaps but usually that would happen over the weekend and it's not as common but it does tend to happen.
The main cause is that there are usually a low trading volume or something and then somebody all of a sudden stepped in and the crypto gapped up or down as the case may be and then eventually it will go back down and come back up which is why they say typically gaps get filled because there's low trading volume in that area. It'll get filled and then it might continue on its way.
Explain the types of Gap (Screenshots required, it is not allowed to use the same images of the class).
Common Gap
With common gaps, there's usually not much you can go off, they happen all the time on intraday charts either on the downside or on the upside. So, it's just fairly common just keep an eye out on it and understand that they typically get filled.
Breakaway Gap
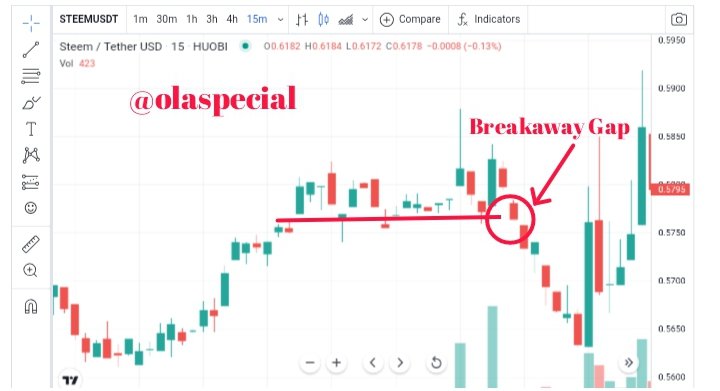
Breakaway gaps are a little bit more meaningful. They're a lot more exciting and there's something that you can trade off of there because it takes time to develop break away gaps. They can happen right in the middle of the trading day. So, they don't have to happen over the next day or from day to day it can happen at any time. But breakaway gaps it's a downward momentum move. What happens is is as a crypto is trending and it's going along support line and it's moving and it's moving in all sorts of ways and it's creating this support or resistance line and all of a sudden sentiment changes and it's going to this downside or up as the case may be and then again it continues trading. So, this part creates the gap.
What happens is as a crypto is trending all of a sudden the sentiment and people's psychology change that it's building and there's a lot of support but that crypto just didn't go anywhere and people just say you know what since it's not going anywhere I'm going to sell it. All of a sudden it just keeps pushing it and boom the crpyto gaps down and then everybody just slowly starts dumping all their asset and that's why the crpyto goes in and it starts selling it to the downside. So that's basically a breakaway gap and it's going down to the side.
The runaway Gap

The runaway gap the runaway gap is very similar to the breakaway gap, instead of going to the downside it's going to the upside.
It can be in different ways the runaway gap can go through. The first one being is it starts with a downward trend and then it goes back up it hops and it continues going or it's going on an incline already it hops it does a gap and then it continues on its path or it's going on a downward trend and then it jumps back up slingshotting and gapping up. So, it can be in different king of ways but the runaway gap is basically a crypto price jumping up towards a new level. Anything that creates positive sentiment creates a runaway gap.
The exhaustion Gaps

The exhaustion gaps are probably another one of those gaps that are the most exciting or very good to trade with if you watch them. However, they can be extremely dangerous if you are still new or aren't spotting them correctly and you're looking for it to go in the wrong direction. An exhaustion gap happens when something shoots up very very high and then it jumps and does another gap or something goes very low it jumps down and then bounces back up.
Through a Demo account, perform the (buy/sell) through Strong Supports and resistances. Explain the procedure (Required Screenshots).
Buy
I will buy/sell BTC/USTD with my demo account. Firstly visit tradingview.com. Launch you chart. Click on and the click on buy.

Set the amount you want to buy.

The buy entry is at that point indicated on the chart

Sell
Selling our crypto, we will go through similar process.


The sell entry is at that point indicated on the chart

Through a Demo account, perform the (buy/sell) through Gaps levels. Explain the procedure (Required Screenshots).
Buy
Click on buy and set the amount you want to buy.

As you can see on the chart below that will have a right moment of entry.

Sell
Launch your chart set the amount want sell
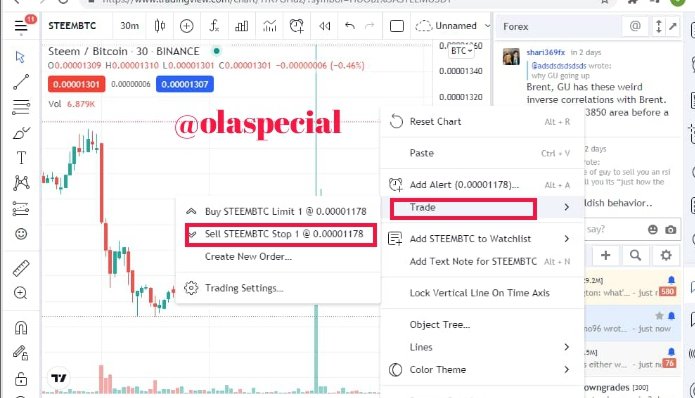
The sell entry is at that point indicated on the chart

I think support and resistance is ignored or at least not given the weight it should be by plenty of new traders. They're too busy focusing on too some indicators, these pivot points, all this sort of stuff and they miss out on this basic bit of market information. It very much importance to know weak and strong resistance level to able to the right moment of entry and exit. Understancding the contept of gap in very it vital to traders. The psychologic of the trader is a factor that contribute to the effect of gaps.