Crypto Academy Season 3 | Crypto Assets and the Random Index (KDJ) | for professor @asaj

In your own words define the random index and explain how it is calculated
Random index is a stochastic oscillator with an additional J line. The J line measure the convergence and divergence of the K and D lines which is surprisingly helpful when a trader is trying to identify the convergence of a particular trend into the rate of change in overbought and oversold. It is a leading indicator that gives traders an insight into what might happen next, which is amazing for identifying breakouts. It functions a lot like RSI and that it tells you if the market is overbought and oversold.
We have a K line representing the slow-moving, the D line is the faster moving, and the J line is an overbought and oversold indicator. If you notice a strong uptrend but the KDJ is above 80% or maybe above 100%, don’t just sell that cryptocurrency just because the indicator says it is overbought. In an uptrend, oscillators can show overbought a lot of times before price actually goes in the opposite direction, so you might get a lot of bad signals, which will either take out your Stop Loss. The same strategy applies to the downtrend also. What's good about the J line is that you don't need to wait till it trending to oversold. If you are scalping in a fraction of a minute, what you are looking for is the change in the direction of the J line.
Calculate the KDJ we need to consider the RSV.
RSV (a) = (Today close - lowest price with a days) / highest price within 9 days - lowest price with 9 day) × 100
- Today K = 2/3×yesterday K + 1/3 × today RSV
- Today D = 2/3 × yesterday D + 1/3 × today K
- Today J = 3 × today K - 2 × today D
Then we get KDJ
If there is no value for KD, then we use.

Is the random index reliable? Explain
It is a reliable indicator when it comes to scalping trading because the J line often gives the perfect signal of where to buy and sell. It gives a false signal sometimes, that is why it is necessary to double-check the signal with other indicators. If you add the other indicator in an uptrend or downtrend when it gives a false signal, you will be able to identify whether the trend is continuing
The recommended parameters is K 9, D 3, J 3
The default parakmeters of KDJ index of stock trading software are 9, 3 and 3 days.
In the KDJ indicator parameters, the smaller the parameter index adjustment, the more the the change in the movement of index graph. When trader change the parameters of KDJ technical indicators, the main adjustment is the days of the first index parameter (9 days in the recommended reference), which can be referred to by different technical form changes formed in different trading cycles.
If the KDJ is too sensitive, more false signals the indicator display. It is good for traders to adjust the KDJ parameter to 6, 3 and 3 days in a short term trading strategy of KDJ because the signal tend to be more reliable. By setting the parameter to 6, 3, and 3 short term, the volatility of KDJ indicator form is large, and the movement of index value is also large, which makes the KDJ indicator create more reliable signal in the short term. Traders can change the KDJ parameter depending in the trader different trading strategies or preferences.
How is the random index added to a chart and what are the recommended parameters? (Screenshot required)
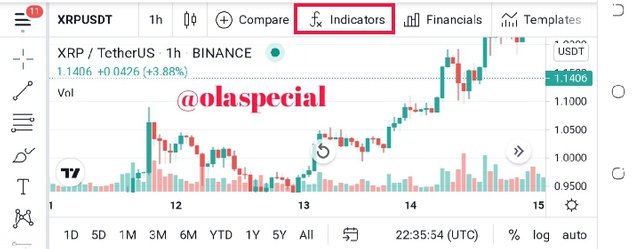
- First visit tradingveiw.com and sign in

- Launch the chart you wish apply your KDJ indicator and click on indicator at the top
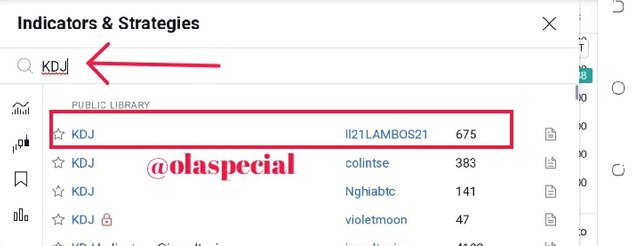
- Enter KDJ in the search bar
- Now we have successful apply KDJ on our chart
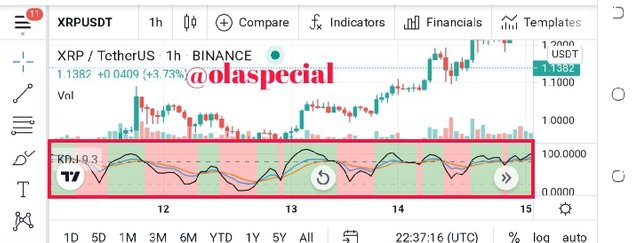
The recommended parameters is K 9, D 3, J 3
The default parameters of KDJ index of stock trading software are 9, 3 and 3 days.
In the KDJ indicator parameters, the smaller the parameter index adjustment, the more the the change in the movement of index graph. When trader change the parameters of KDJ technical indicators, the main adjustment is the days of the first index parameter (9 days in the recommended reference), which can be referred to by different technical form changes formed in different trading cycles.
If the KDJ is too sensitive, more false signals the indicator display. It is good for traders to adjust the KDJ parameter to 6, 3 and 3 days in a short term trading strategy of KDJ because the signal tend to be more reliable. By setting the parameter to 6, 3, and 3 short term, the volatility of KDJ indicator form is large, and the movement of index value is also large, which makes the KDJ indicator create more reliable signal in the short term. Traders can change the KDJ parameter depending in the trader different trading strategies or preferences.
Differences between KDJ, ADX, and ATR.
| KDJ | ADX | ATR |
|---|---|---|
| KDJ has 3 lines which are the K line, D line, and J line. | ADX has 3 lines which are +DI: Positive direction indicator, -DI: Negative direction indicator | ATR has only one line |
| The KDJ indicator J line measure the convergence and divergence of the K and D. | ADX identify the potency or effectiveness of a trend. | The ATR indicator can help trader confirm when they might want to enter a trade or exit a trade. |
| KJD don't gives direct answer to we are currently in a high or low | ADX gives a direct answer to whether we are currently in a high or low volatility area irrespective of the cryptocurrency analyzed, and the time frame we choose. | ATR tells what a statistically significant price move is for a certain cryptocurrency in a particular time frame. |
| The J line is the major determinant factor of entry and exit | ADX provides a direct answer to what is "low" and "high" for volatility, it can't tell us what is a statistically significant move for the cryptocurrency analyzed in our chosen trading time frame. | ATR tells us what a statistically significant price move is for our chosen cryptocurrency given our desired trading time frame. |
| KDJ was developed by George Lane in 1950s | ADX was created by J. Welles in 1978 | ART was created by J.Welles in 1984 |
| The recommended parameter for KDJ is 9,3,3 | The recommended parameter for ADX is 14,14,14 | The recommended parameter for ATR is 14 |
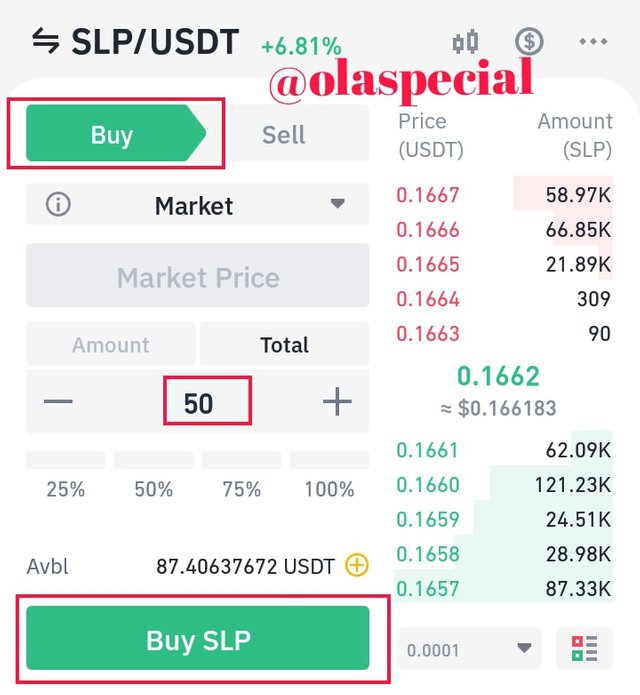
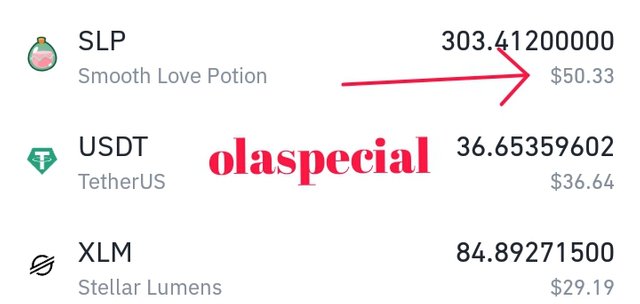
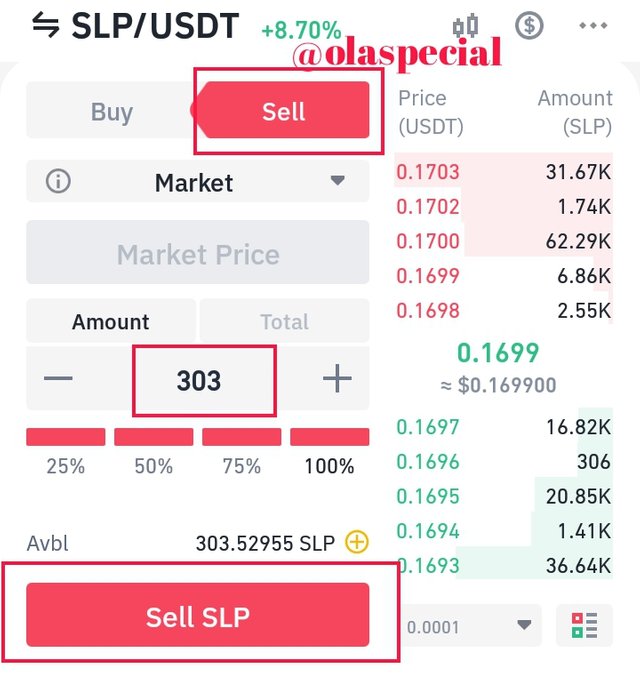
Use the signals of the random index to buy and sell any two cryptocurrencies. (Screenshot required).
As we can see on the screen short below that is at the overbought level that signal the moment of entry
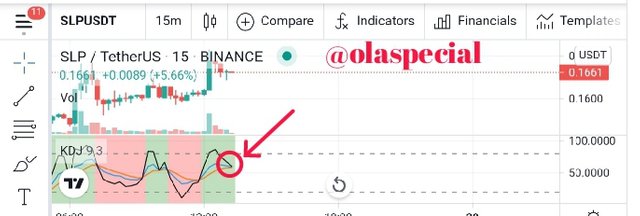
As we can see on the screenshort below that the J line is at the overbought level and it was about to cross the KD line, that signal an exit moment.
KDJ is a good indicator, most expecially K line because it give perfect signal of entry and exit. Though, in a strong up trend or down trend is signals are not alwag reliable but it still be use predict the market. Just like other indicators, we have be about an indicator to be sure how to use it perfectly and also it advisable to combine it with some other indicators.
Good job @olaspecial!
Thanks for performing the above task in the eighth week of Steemit Crypto Academy Season 3. The time and effort put into this work is appreciated. Hence, you have scored 8 out of 10. Here are the details:
Remarks
You have displayed a good understanding of the topic. You have completed the assigned task. As a suggestion, it is advisable to use a demo account on indicators you just learnt about.