Steemit Crypto Academy season 4 - beginner's course homework post for Task 10 - Candlestick Patterns

1a. Explain the Japanese candlestick chart? (Original screenshot required).
b. In your own own words, explain why the Japanese Candlestick chart is the most used in the financial market.
c. Describe a bullish and a bearish candle. Also, explain its anatomy. (Original screenshot required)

Explaining the Japanese candlestick chart? (With original screenshot required)
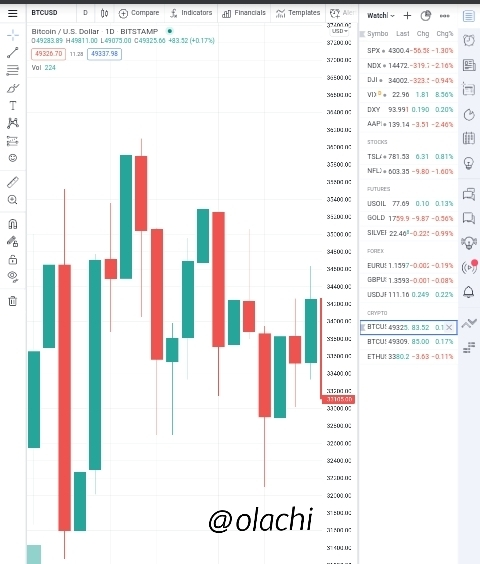
The Japanese candlestick is a technical tool used by traders to get an assets price information within a given time. They are considered to be an extremely useful tool because traders can easily use them for analysis of price trends and future predictions.
Candlesticks were created by Homma Munehisa, a Japanese rice trader who was born in the early 1700s.
Japanese candlesticks are the most comprehensive type of chart showing crucial prices: open, close, high and low.
They offer beneficial information, like marketplace sentiment or viable reversals within the markets, by displaying the movement in price. Traders choose candlestick charts due to the fact they consist of greater data than a line chart and may be greater beneficial for making buying and selling decisions.
source
How a Candlestick looks
In my own words, explaining why the Japanese Candlestick chart is mostly used in the financial market.
The candlestick chat is mainly used in the financial market as it is considered to be a visual representation of what is happening in the financial market.
With the help of a candlestick, we can acquire useful information on the open, high, close and low of the price, that can provide hint or tip on movement of price.
Candlesticks are flexible, they may be used alone or together with other technical tools like the momentum oscillators, and moving averages.
With the presence of candle patterns, it will assist the trader to know when to enter, exit, and stay out of the market.
Describe a bullish and a bearish candle. Also, explain its anatomy. (With original screenshot required)
source
Now let's talk about these two candles and their anatomy.
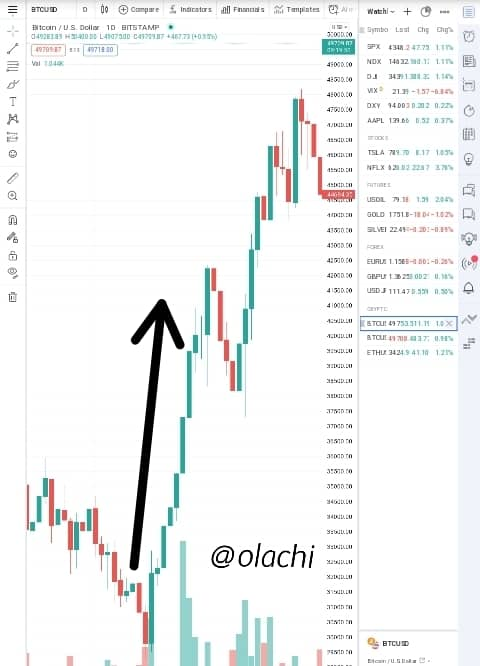
BULLISH CANDLESTICKS
With the bullish candlestick patterns we can see that the closing price was greater now than the opening price for a given time of an asset. This generates buying pressure for investors because of the potential for continued price value.
source
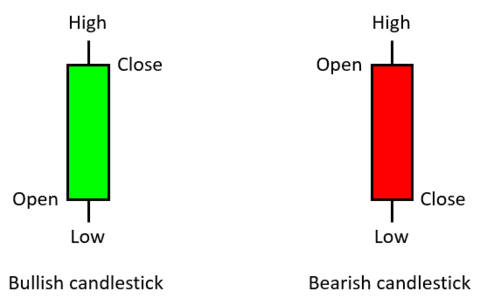
Bullish candlestick anatomy
A bullish candle is made up of 4 main parts, which are the Open, close, high, and the low.
Open: Also known as the opening price. It shows the price movement is moving up. It is the point and price where the market opens up for the day
Close: It is the reverse of open price. It indicates the end of the candle for a given time and normally is the last price taken for the period.
High: Highest price reached by an asset over a period of time and is seen above the closing or same point as the closing point.
Low: This is the lowest price reached by an asset over a period of time. The lowest price is below or same point as the open point.
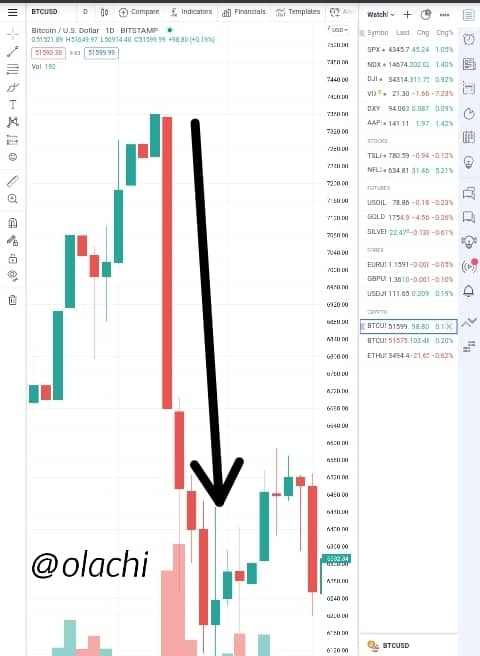
BEARISH CANDLESTICK
The Bearish Candle indicates that the closing price for the given time of an asset is lower than the open price. This generates instant selling force for investors because of fall in price assumption.
source
Bearish Candlestick anatomy
Made up of are; Open, Close, High and Low
Open: This is starting point of the candle in a particular time frame. It marks the start of a price movement in a bearish direction.
Close: It means the end of the candle within a certain period of time. This is the last price of a stock over a time period.
High: It is the highest point reached by an asset in a period of time and is seen above the open or at the same point as the open point.
Low: It dictates the lowest price reached by an asset in a given period of time.
Cc:
Professor @reminiscence01