Crypto Academy || Season 3 || Week 3- Homework Post for [@lenonmc21] Trends, Supports and Resistances and simple chart patterns by @olachi
Define in your own words what is a "Trend" and trend lines and what is their role in charts?
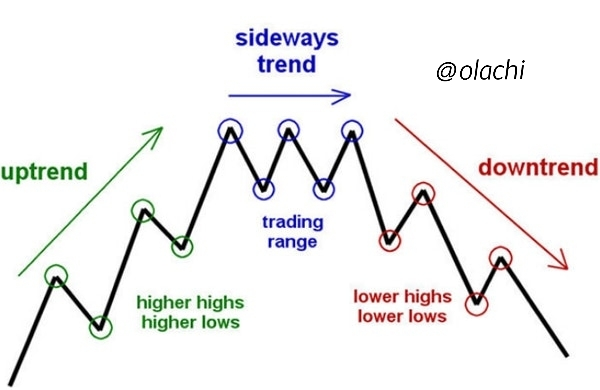
A trend can be said to be the movement in the direction of the price of an asset. So, for easy findings on the direction of the market,trendline is needed. It's either moving in bullish (uptrend) or bearish (downtrend) direction
Trend lines are lines used when trading to determine the uptrend or downtrend of an assets price. Tred lines are the lines linking the Lows and highs. It's a technical analytic tool which is used to check the movent of a market by the traders.
There exist two types of trendlines pending on the direction. We have;
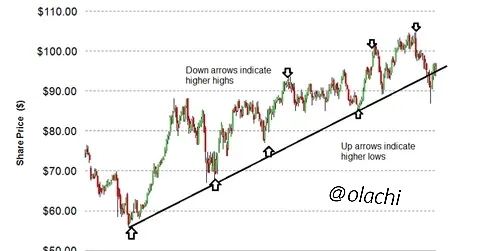
Upward trendline (ascending)
These trendline which posses an upward slope is known as upward trendline. The upward trendlines shows an up-trend in the market which means that the buyers are in charge of the market.Downward trendline (descending)
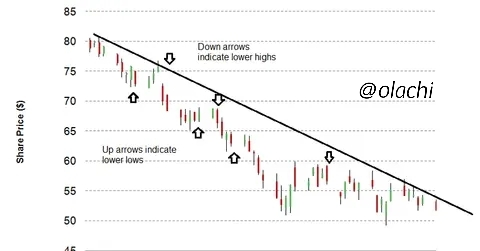
These trendline which possess a downward slope. The downward trendline tells us there is a down-trending market. It also means that the sellers are with the momentum of the market.
- traders have chances of increasing their making more profit with this trading tool.
- trend line gives an easy way to know the weak trends and the strong trends.
- Trend line helps to in determining if a chart is been bullish, Bearish or indicating the sideways trend as well.
- It also opens the trader to the risks involved with a particular asset
- Is of good help to the traders in predicting the price movement of an asset
Explain how to draw an uptrend line and a downtrend line (Show a screenshot of each).
- The up-trend line drawn is an ascending trendline in the chart
- The uptrend line here is seen below the price.
- To draw this trendline is to comnet the higher lows.
- For this trendline to be valid,it needs at least two to three touches for confirmations.
- To get it done accurately, make sure to cover the wick of the candle.
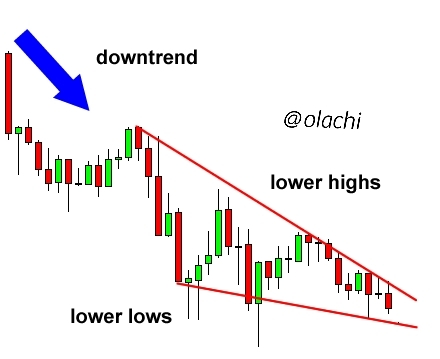
- The down trend line is drawn in a descending order.
- The line of the downtrend is drawn above the price
- The line drawn connects all the low highs.
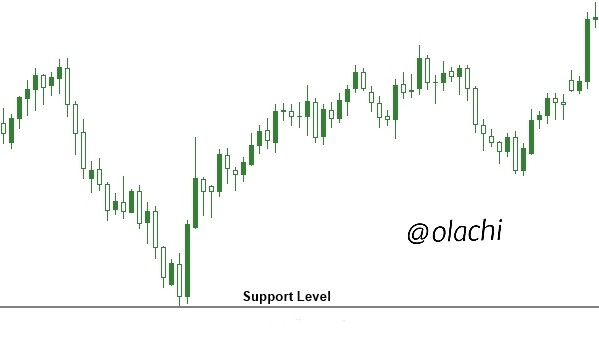
Define in your own words what "Supports and Resistances are and how we can identify both zones (Show a screenshot of each one).
The support level is the level in price where the price may find buying interest as it is moving down. This simply means that the price is more likely to "rebound" off this level instead of breaking through it.
Nevertheless, once the price passes this level, by an amount, then is likely to keep dropping until it locates another support level.
A resistance level also is the opposite of the support level. Here the price may discover selling force as it is moving up. This means the price here likely may keep moving up till it locates another resistance level.
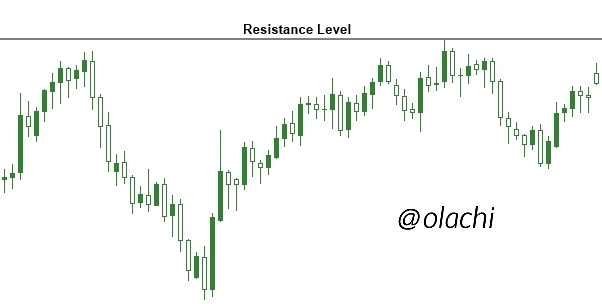
- identifying them through peaks and troughs in a chart, finding and marking the high peak as the all time high (ATH) and also marking the low bottom as the All time low (ATL)
- Also we can identify them through their trend lines
- we can also identify the support and resistance levels by looking in higher time frame.
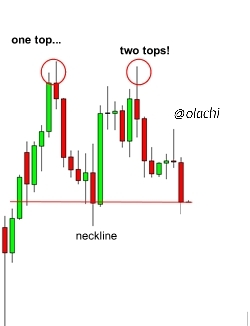
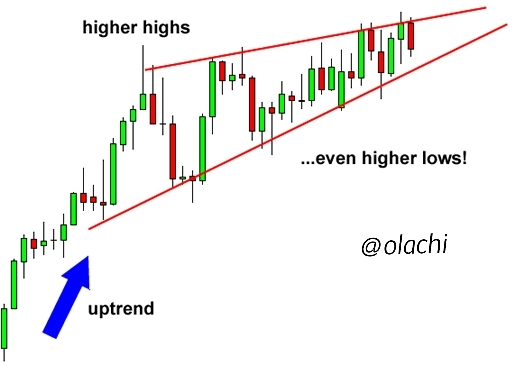
Explain in your own words at least 2 simple chart patterns with screenshots.
Double roof pattern is formed when the price must have gotten to a resistance level, the price getting to a specific point then makes a touch, moves down, making a back up and making one more touch.
The Rising Wedge pattern forms with the market making a higher highs and higher lows within a shrinking range with an upward slope. Taking note the highs and lows been in-line as to be connected by a trendline.
The Falling Wedge pattern forms with the market making lower highs and lower lows within a shrinking range with a downward slope.
Trend line gives a clear understanding when establishing and when analyzing a trend, but when used inaccurately can also lead to signals been false. With trend analysis one can spot when their is an upward or downward in relation to the bearish & bullish markets. The trend analysis also helps the trader to predict the future with ideas from the past.
Cc:
Professor @lenonmc21
hello, you are part of the 500sp healing support, but remember to post in the steemit nursery community and always put your achievement 1 in the post. so you can keep increasing your steempower.