Steemit Crypto Academy Season 2-Week 8 | Cryptocurrency Trading with Bollinger Bands| kouba01
It is with great pleasure as I participate in this week assignment given by my amiable professor @kouba01, of which i learn from his lessons on how to perform Cryptocurrency Trading using Bollinger Band indicator.

Define the Bollinger Bands indicator by explaining its calculation method, how does it work? and what is the best Bollinger Band setup?

Bollinger band indicator was invented in the early 1980s by John bollinger, it is an essential tools of technical analysis used in predicting the price reversal and the continuation of an asset in the candlestick graph, the price volatility of an asset can be measured with the use of Bollinger band indicator which is also a technical indicator, Bollinger band indicator also can be used to get the oversold or overbought position of the price of an asset.
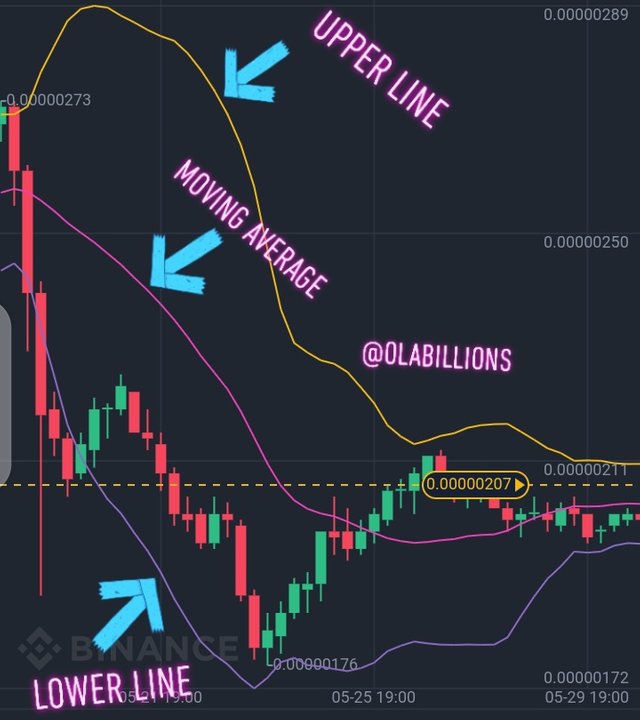
The Bollinger band consist of three lines in which the middle line represent the simple moving average, the upper line as the name implies is above the moving average and the lower line which is below the moving average.
HOW ITS WORKS
Bollinger band allows a trader to determine and clearly see the ups and downs of the market, this implies that, when price of an asset touches the upper line of the Bollinger band indicator, the asset is said to be overbought, on the other hand when the price troughs below the moving average to the lower line of the Bollinger band indicator the asset is said to be oversold.

Note: For more certainty of determining the the overbought and oversold position with the Bollinger band indicator other indicator like RSI should be combined together for better decisions.
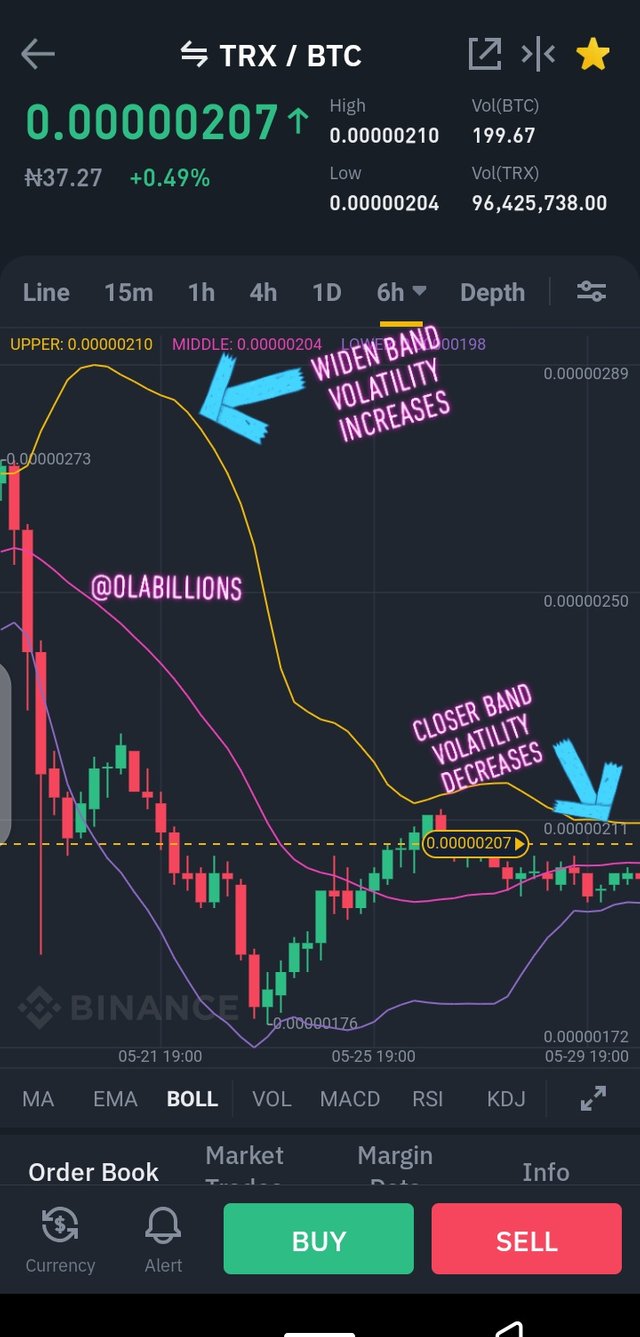
Bollinger band indicator help to show the volatility of the an asset in the market, where by if the Bollinger band indicator widens which are the upper line and lower line, the market is said to be volatile and if the Bollinger band indicator are very thin in which it shrink or squeeze it means the market is less volatile.
CALCULATION OF BOLLINGER BAND INDICATOR
Moving Average = Sum of prices over x days/number of days
Bollinger band is calculated by moving average eqauls to the sum of price of numbers of day divided by the number of days for example if a trader trade for 20 days and made different profit for each day, the trader doesn't just state the profit made per each day however he sums up the profit made in each day of the number of days and divide it by the number of day he traded.
WHAT IS THE BEST BOLLINGER BAND INDICATOR SETUP?
The Bollinger band indicator consist of line which help to determine the trends of price which are the moving average, the upperline and the lower line, the middle line represent the moving average and the upper which is plus 2 (+2) standard deviation which is above the moving average and the lower line below the moving average is minus 2 (-2)standard deviation, Bollinger band indicator is best used at a 20 days moving average, I can be altered by settling the simple moving average to 5, 10, 20, 50 days moving average,when set at 10 the standard deviation will of the upper line will be plus 1.5 (+1.5) and the lower line will be minus 1.5 (-1.5) and on a 50days moving average the standard deviation will be (+2.5 and - 2.5) on the both lines but it's default is 20 moving average which is best for trading.
What is a breakout and how do you determine it? (Screenshot required)
When the price of an asset increases above to a resistance level or decreases below to a support level this is known to be a break out in crpto pair, a breakout can be seen in an upward direction which is the overbought signal and a downward direction which is the oversold signal, in the case of a breakout in the Bollinger band indicator, if the indicator becomes thin leaving a small space between the moving average and the upper, lower line trades tend to look out as there will be a break out in which the price comes out of the indicator which then start to widen.
How to use Bollinger bands with a trending market? (screenshot required)
The use of Bollinger band requires study of the indicator, Bollinger band moves in waves as the price of an asset changes, Bollinger band can be used in a bullish market where by, if the price of an asset set back from the upper line and touches the moving average, that position is refers to an oversold position where by trader set their buy price in the hope to take profit
The Bollinger band uses the bearish market also to make certain position for traders, in a bearish market using the Bollinger band indicator where by there is a fall in the price of an asset and then a set back was seen in which the price of an asset found support and touches the moving average from the lower line, that position is to make a sell position and take profit for those who have a better understanding of how to use the Bollinger band indicator.


The screenshots above indicate the use of a Bollinger band indicator in a bullish and bearish market.
What is the best indicator to use with Bollinger Bands to make your trade more meaningful? (Screenshot required) (Screenshot required)
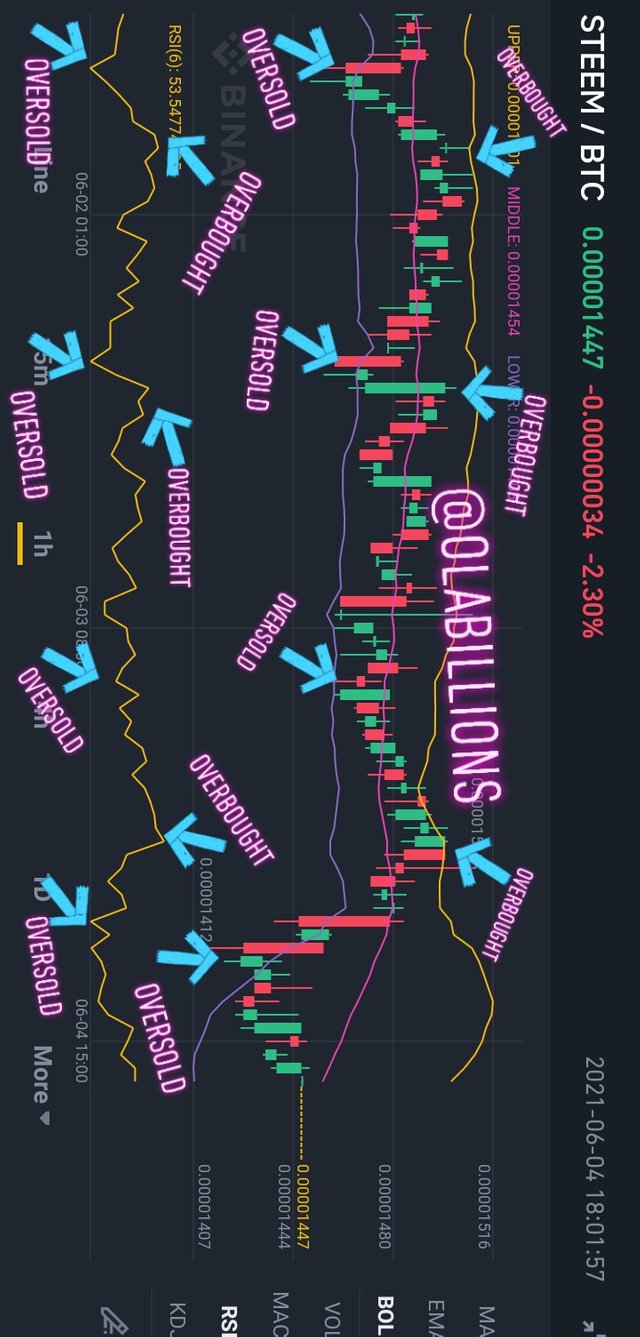
An indicator is best used when combined with another indicator, Bollinger band indicator can be combined with any indicator so far a trader knows the use of both indicator, but I will be combining the Bollinger band indicator with the RSI indicator because RSI indicator indicate the overbought and oversold position of the price of an asset, RSI measures a reading of 70 as an overbought signal and a reading of 30 as an oversold signal.
The bollinger band indicator and the RSI will work effectively when combined together because both indicators aims are to give price signal of a asset, the overbought and oversold signal are determined in the bollinger band indicator when the price touches the upper line and the lower line combining the RSI will give trader more certainty about this position been in an overbought position which the bollinger band will be touching the upper line cross checking with the RSI indicator is touching the position 70 hence, this is a certain and a sure overbought position because both indicator are indicating one signal, same implies in the over sold position if the bollinger band is touching the lower line hence the RSI is also touching the position 30 this is also a certain oversold position because both are not saying otherwise.
What timeframe does the Bollinger Bands work best on?And why? (Screenshots required)
All inidicators works on all time frame, but which is best for the specific indicator of use, in the case of Bollinger band indicator, it can be used in any time frame depending on the traders trading experience or preference of the trade, using the Bollinger band indicator as a swing trader will be the best for me been a holder that I am, swing trader like me will prefer to use the Bollinger band indicator for weekly and daily time frame, a scalper will like make multiple entry and exit point in a day so we can see a scalper In a minute or 5min time frame.
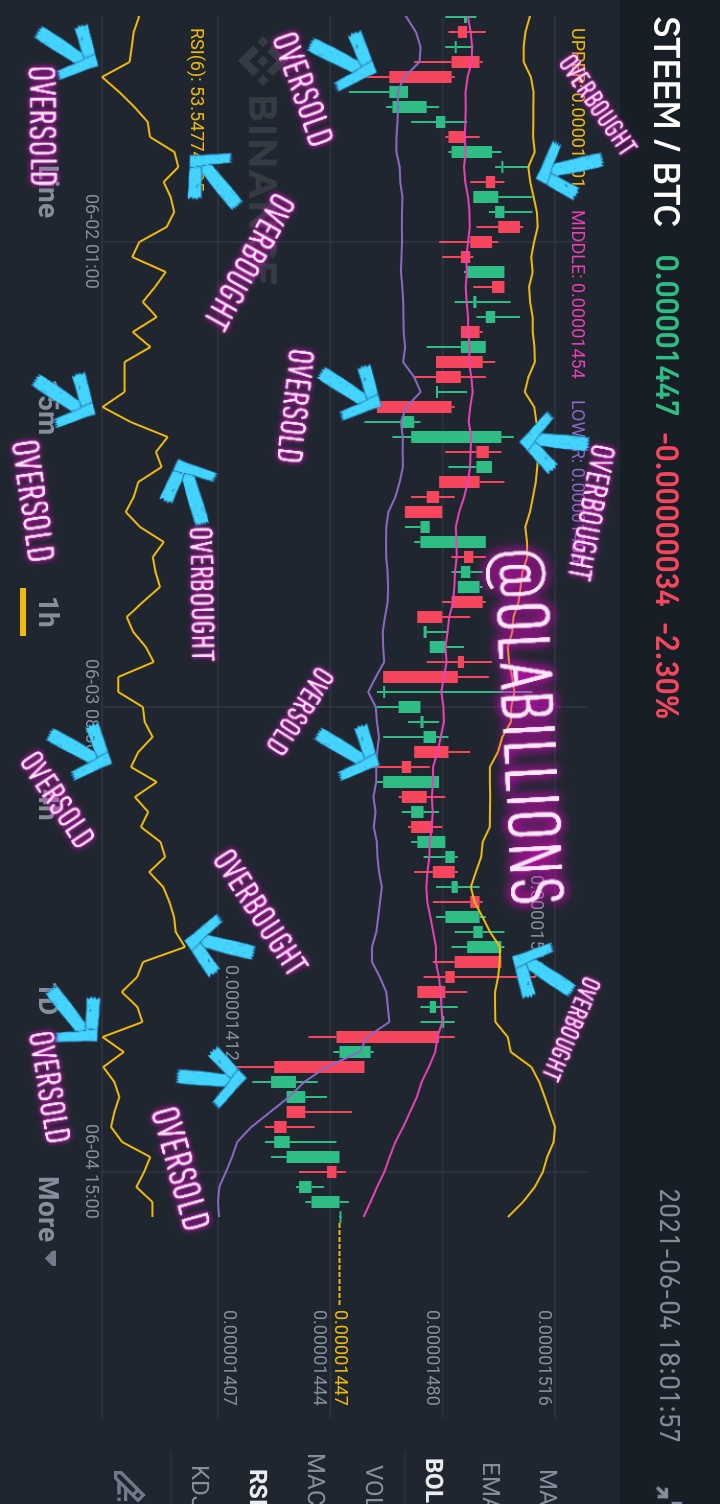
Review the chart of any pair and present the various signals giving by the indicator Bollinger Bands. (Screenshot required)
For the sake of completing the questions asked by the professor I will be reposting all picture as they were from my exchange and all signals have been explained by me in the previous question
As you can see the above screenshots of STEEM/BTC, the Bollinger indicator is used to indicate the overbought and oversold signal, which is therefore the buy and sell signal, let us not forget that to derive this signals if from above the price dips crossing the moving average seen in a downtrend, it is a bearish signal, and otherwise if from below, price seen crossing above the moving average hence it is a bullish signal.
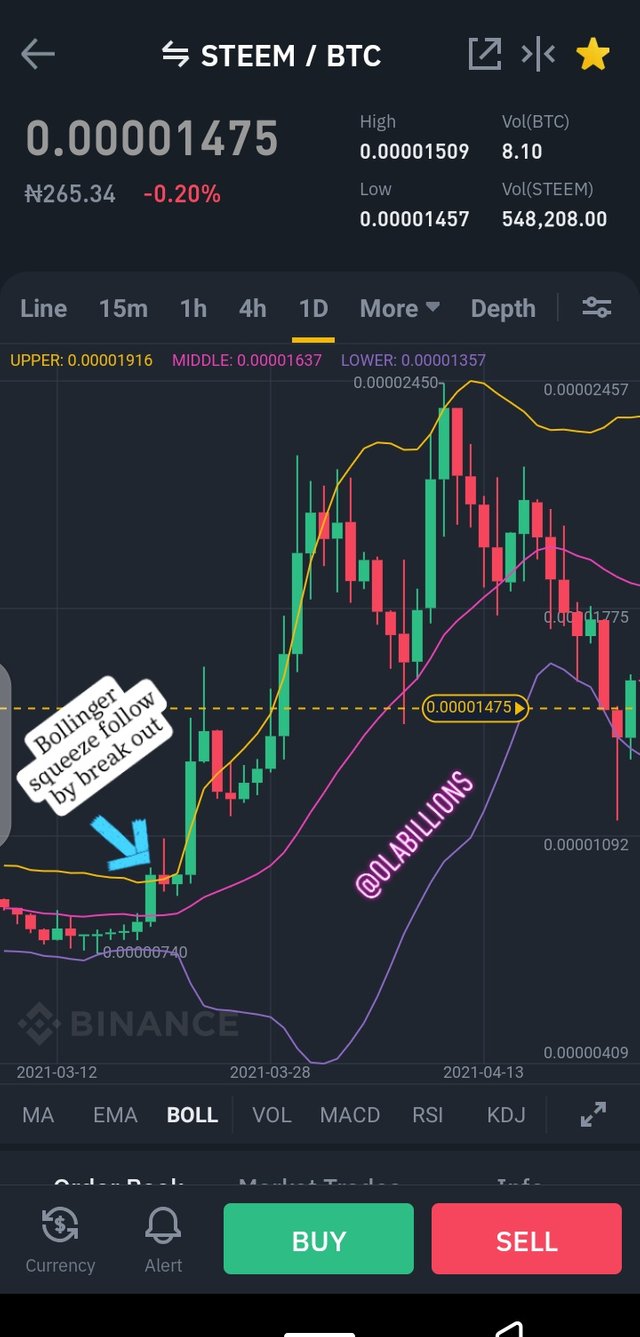
the breakout in price of STEEM/BTC is seen when after a bollinger bad squeeze and a breakout occur expanding the bollinger band indicator, STEEM/BTC breakout above resistance seeing the chart pattern out of the upper line of the bollinger band.
Conclusion
Bollinger band indicator is a good indicator used to determine the volatility of an asset, the combination of this indicator and other indicator will be effective and give confident signal to users or traders, note, stoploss should be included in your trade when using the Bollinger band indicator, as false signal could occur.
Cc: @kouba01

Hello @olabillions,
Thank you for participating in the 8th Week Crypto Course in its second season and for your efforts to complete the suggested tasks, you deserve a 9/10 rating, according to the following scale:
My review :
Work with excellent content, good answer to all questions with good analysis of most of the points raised. The result of your following a clear methodology and a set of accurate information.
Thanks again for your effort, and we look forward to reading your next work.
Sincerely,@kouba01