Steemit Crypto Academy | Season 3: Week 7| Homework post for @yousafharoonkhan || How to create an account on TradingView, how to use indicators,tools, features of tradingview
assalam-mun-alaikum warah motulahi wabarakatu
It is with great pleasure to be a participant in this week assignment of professor @yousafharoonkhan, which he taught about How to create an account on TradingView, how to use indicators,tools, features of tradingview, I can say I understood the class and I have been able to give back based on my own understanding and the research I made. I stand corrected in any way as I might have come short in details of a particular question.
Bismillah
Question no 1:
Defining the TradingView site and how to register an account in tradingview? what are the different registration plan?(screenshot necessary)
Trading views is an application or website that enables trader to make profit from their trade, it also is an online trading platform that traders use to analyse chart of stocks, crypto currency and commodities and all global market including forex chart.
Trading views contains several trading tools like indicators and and also pointing out some information on chart with different lines like horizontal and vertical lines. Shapes of different kind can be used if needed in trading views website, trading views can be used on mobile devices and computer devices.
In a nutshell, trading views is a trading website used by traders in analysing lot of different market trade. For new and old users, trading views should be used as it contains several trading techniques and information that helps trader when trading.
Google search the word trading views.
Click on the first option from the search after then the website opens there you begin the creation of account
Next, click on sign in, another page appears, then click on sign up as indicated by the arrow.
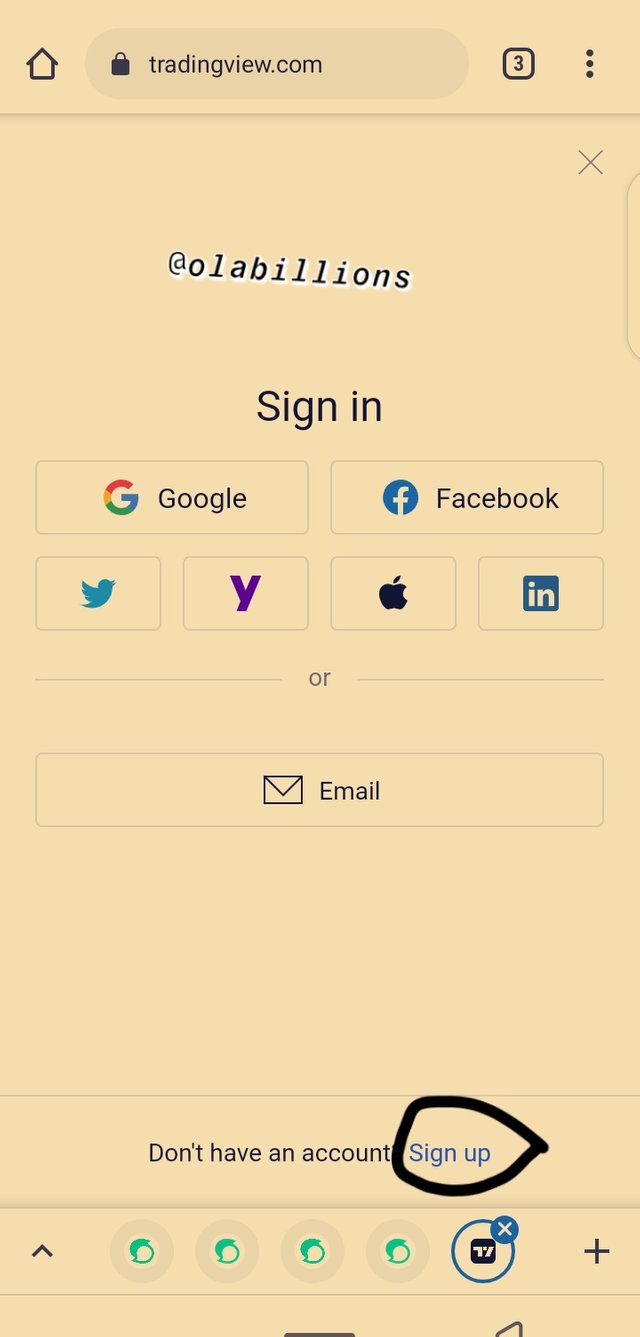
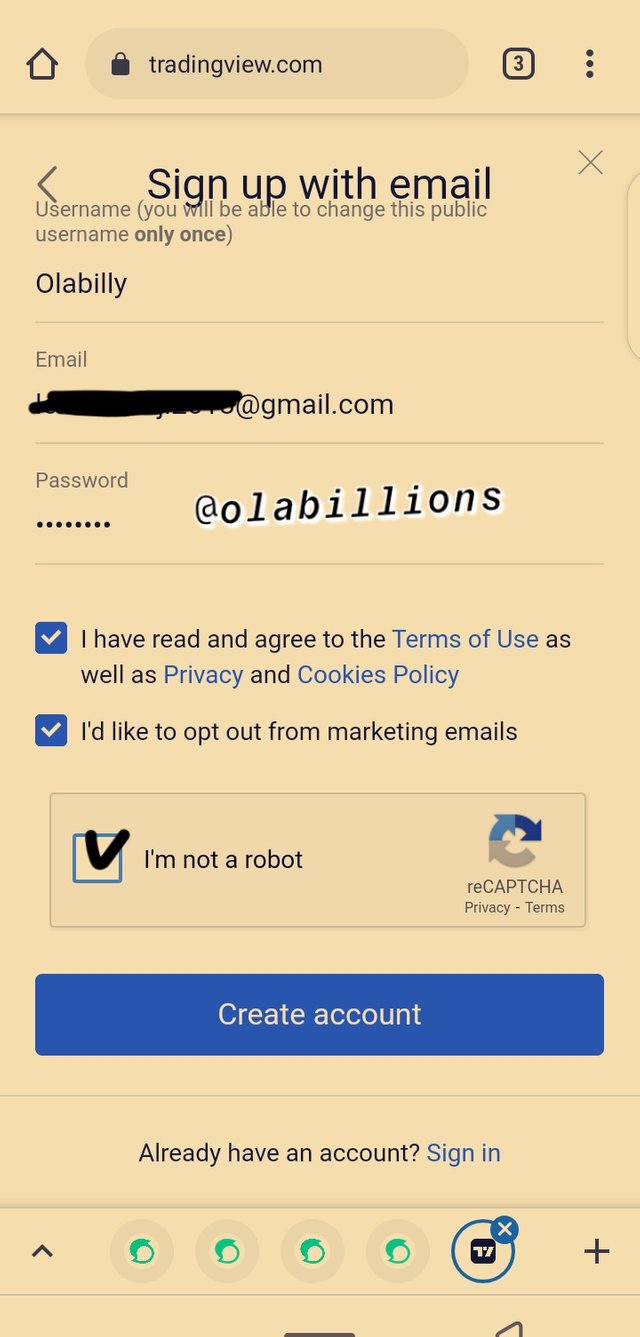
There are numerous ways to sign up but I'll be signing up through email
In the email section fill in your username, email and password and agree to the terms of service, then click on create an account after verifying a captcha.
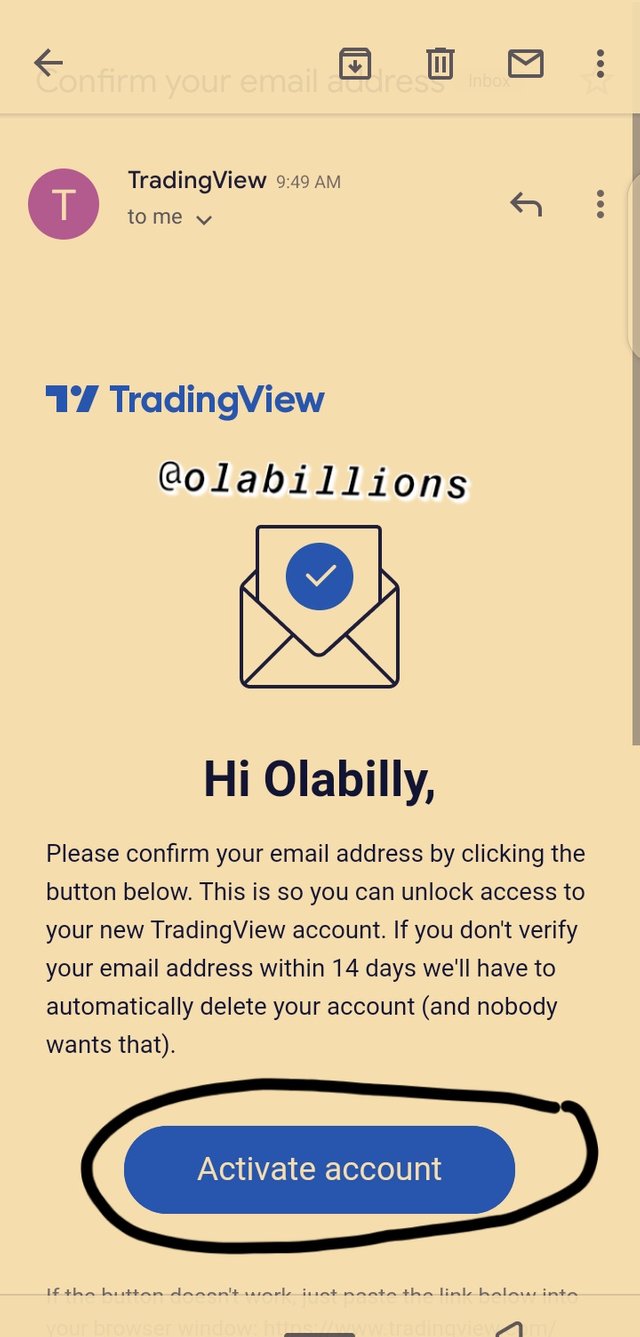
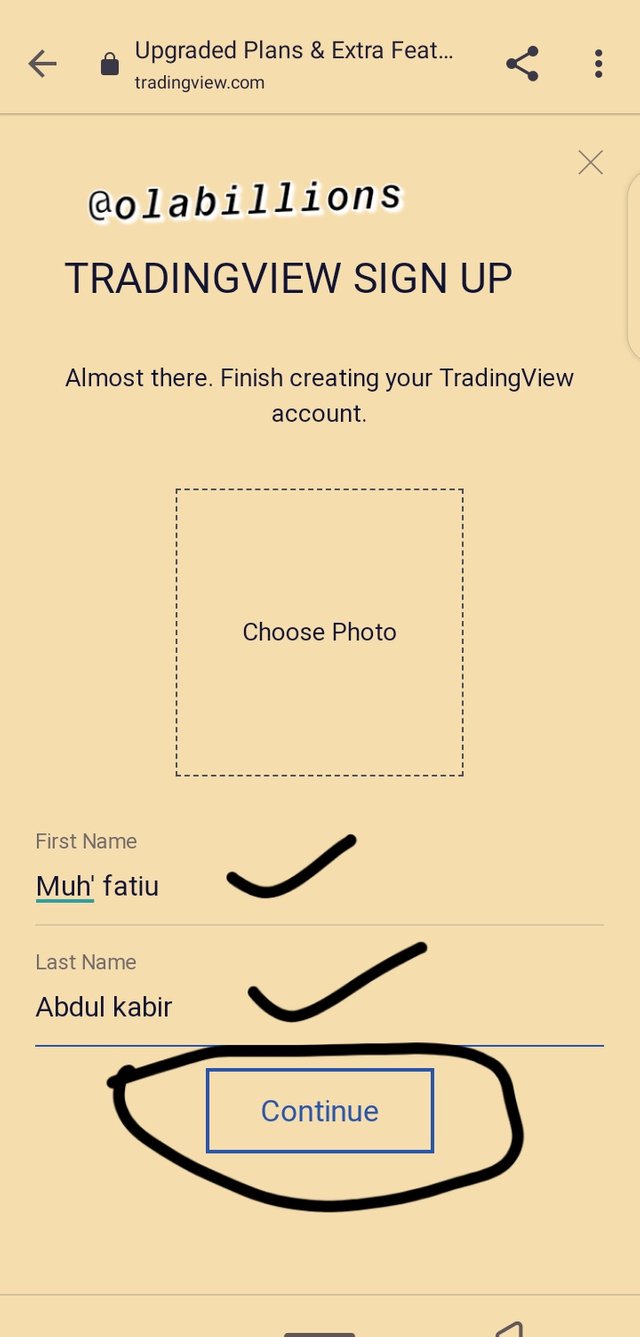
A link will be sent to your email, click on the link sent to the given email, by doing so, we are into the tradingviews free basic account
Verification details will be asked to fill, like first name, last name and a profile picture, after that we have successfully registered an account in trading views.
TRADING VIEW REGISTRATION PLANS
After creating an account, we are already in a free basic plan where we use trading views for free and some free basic features.
Trading views enables free basic plan for beginners and pro, pro+ and premium plan for professionals ie traders/investors, youtubers or tutors.
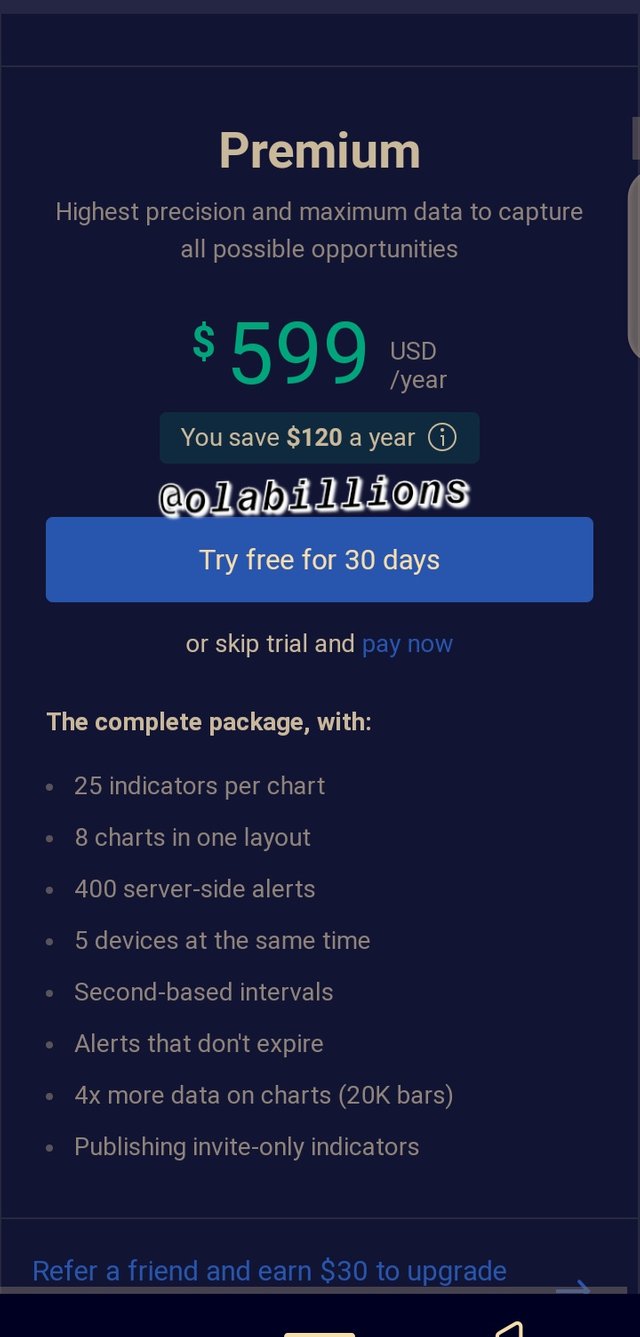
To buy a plan in trading views, there are three plans available of which these plans are not free, they require a certain amount to suscribe to it monthly or annually, for 30days, this plans can be used at free cost.
Let check the cost monthly
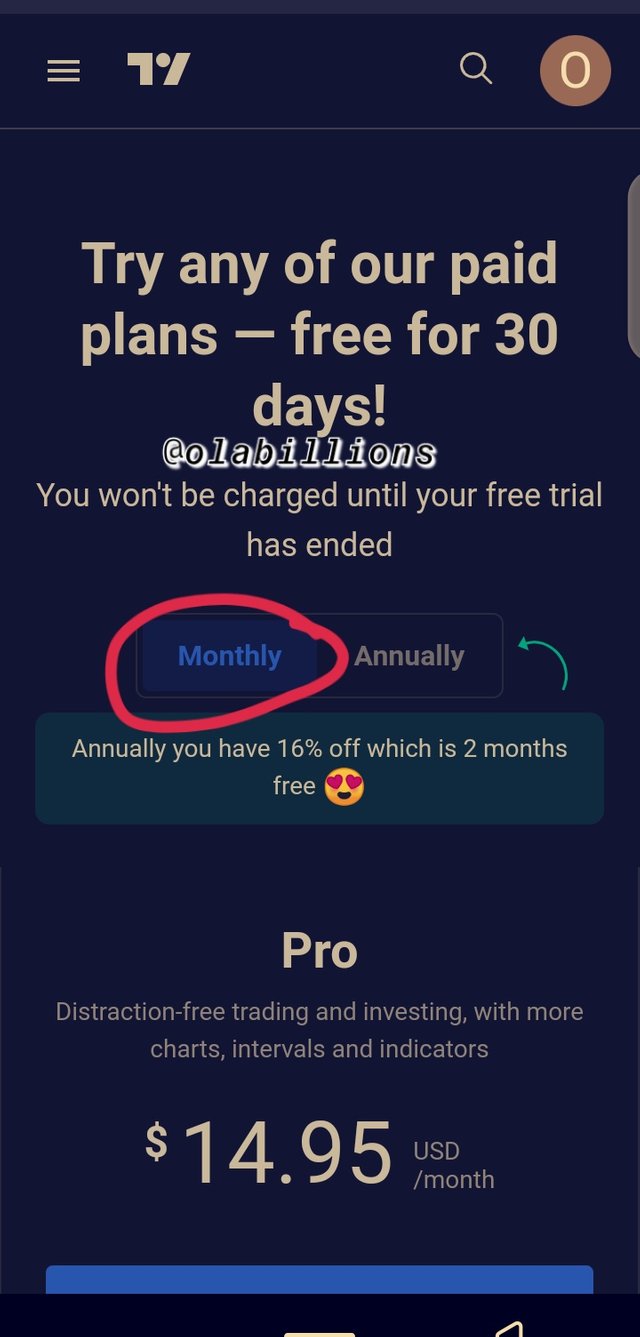
Monthly plan
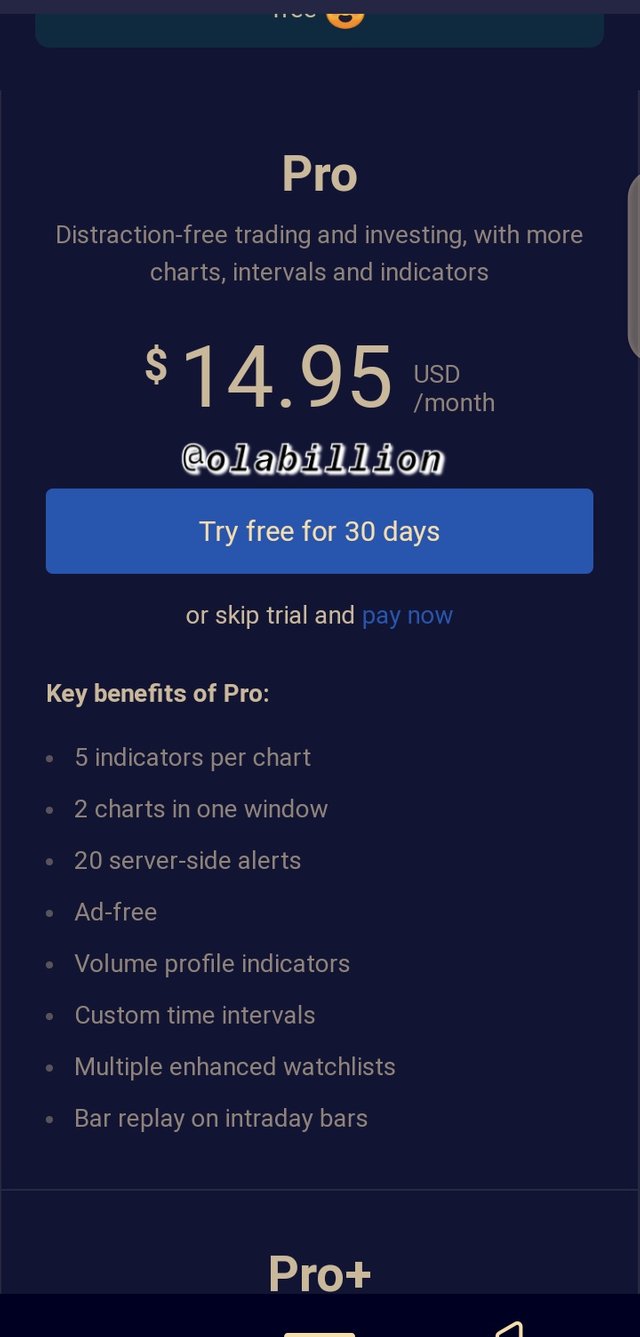
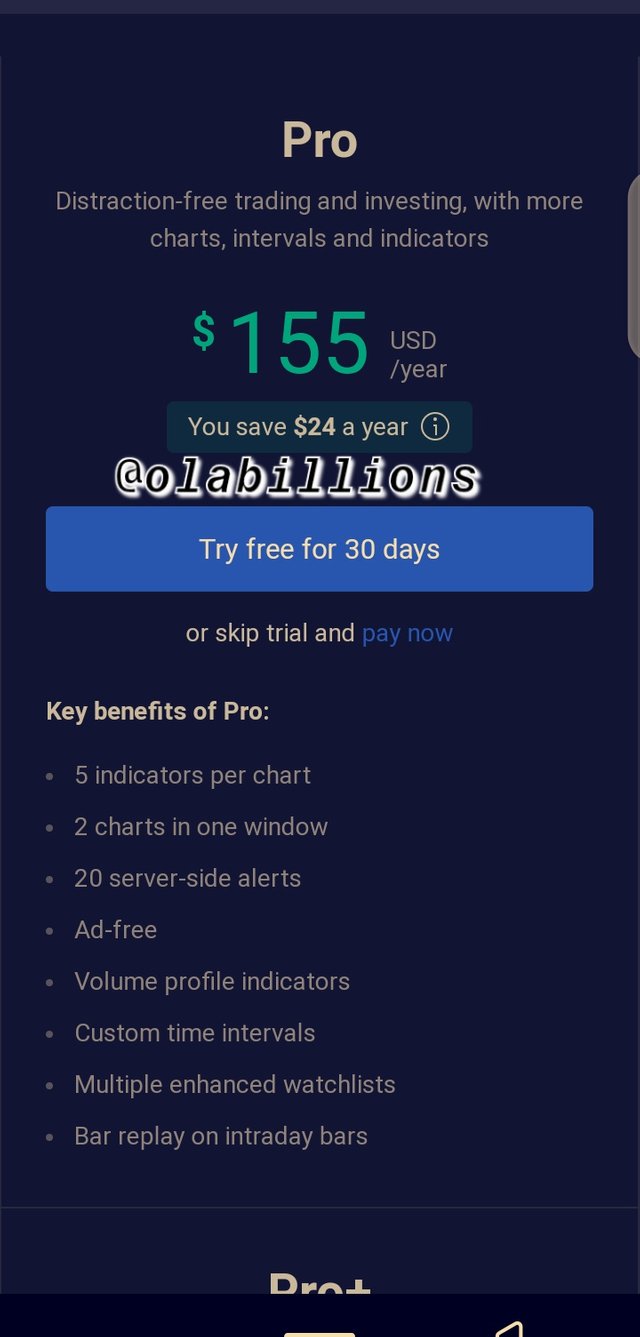
For pro = 14.94 USD
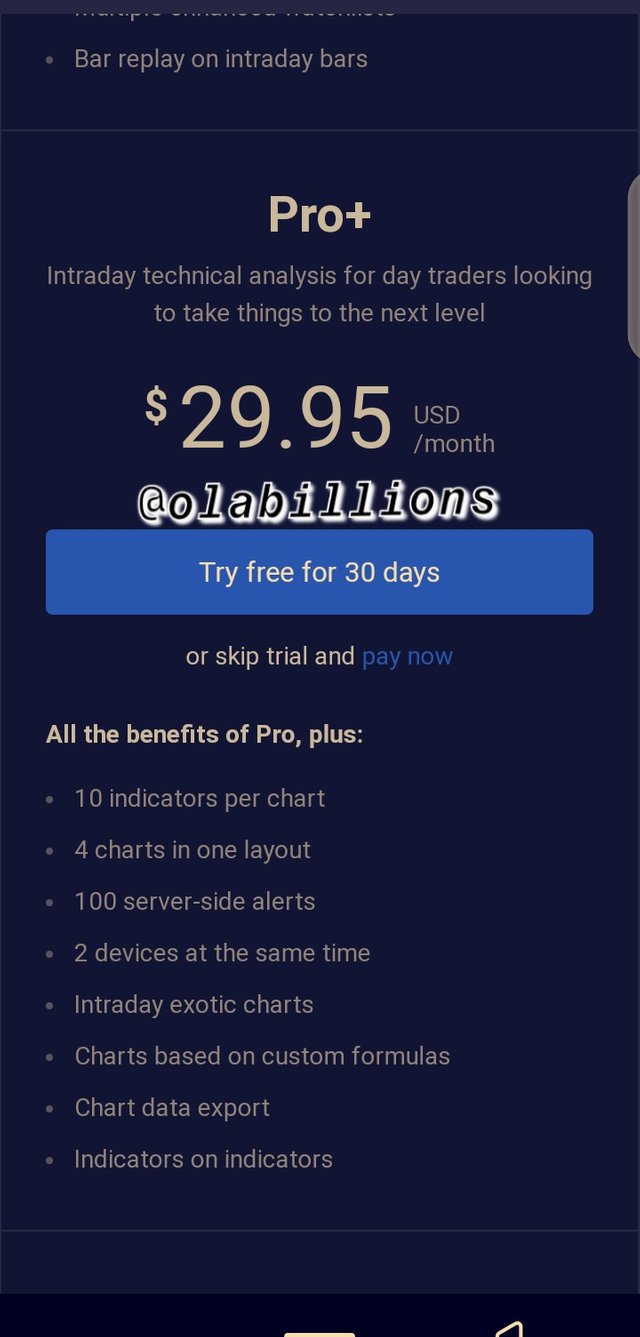
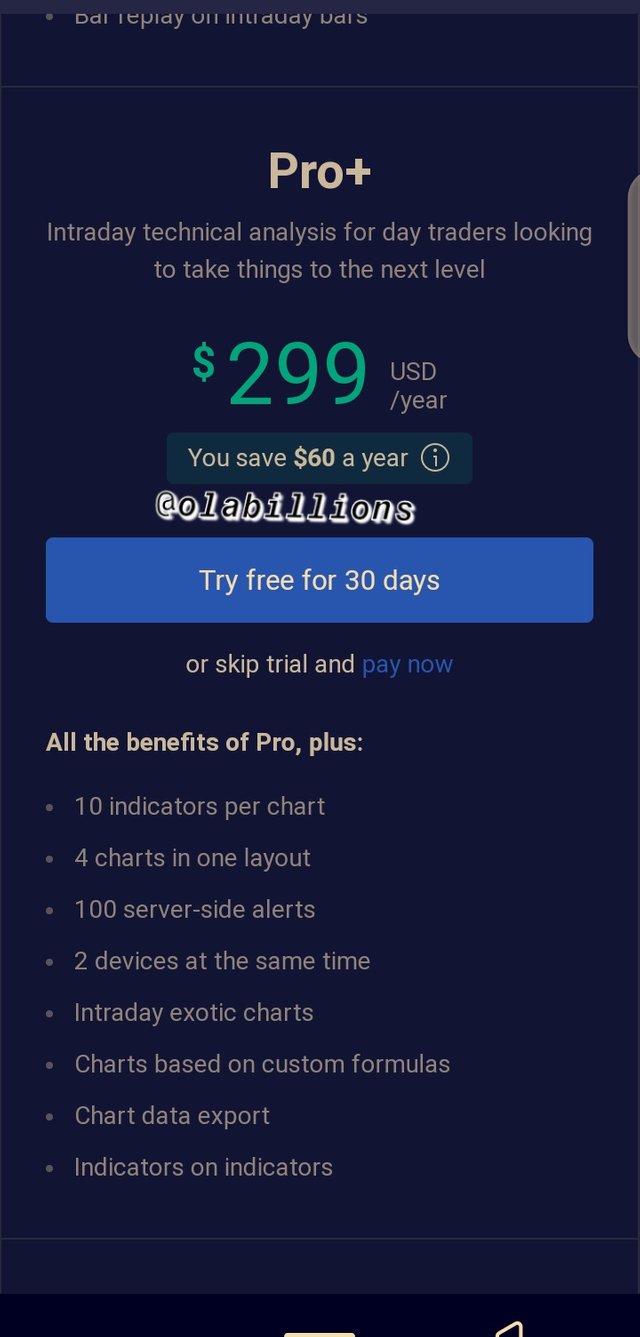
For pro+ = 29.95 USD
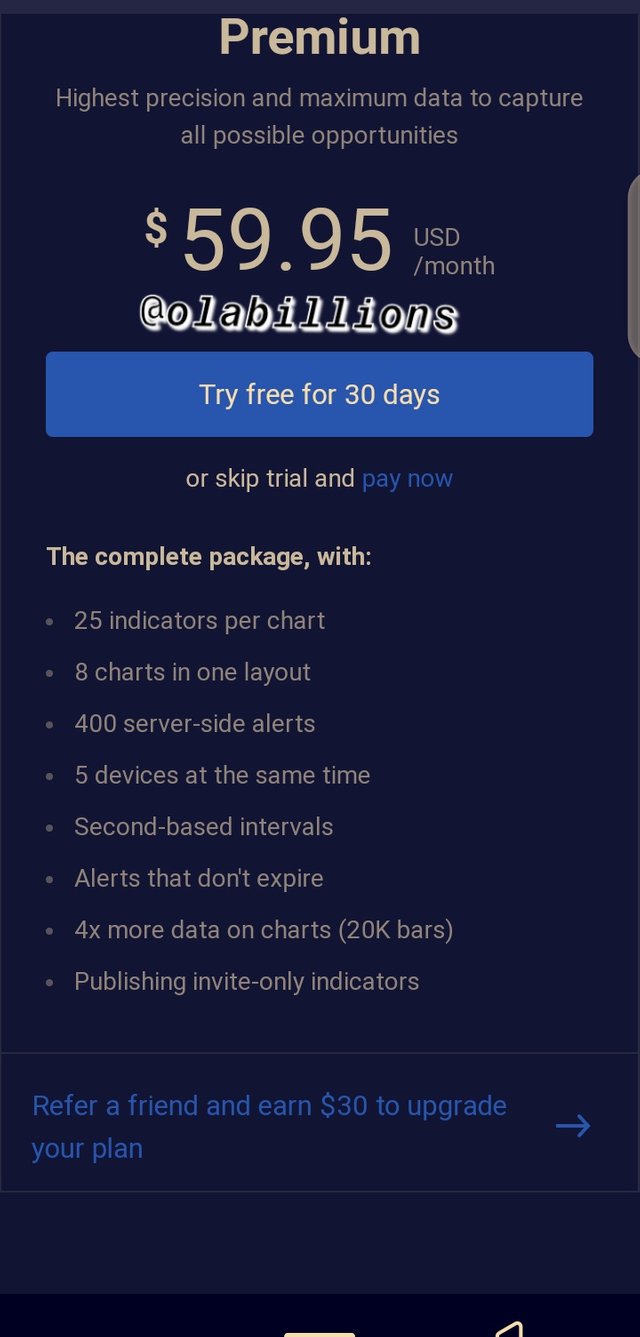
For premium = 59.95USD
In the screenshot you can see various benefit for different plans monthly.
Let check the cost annually
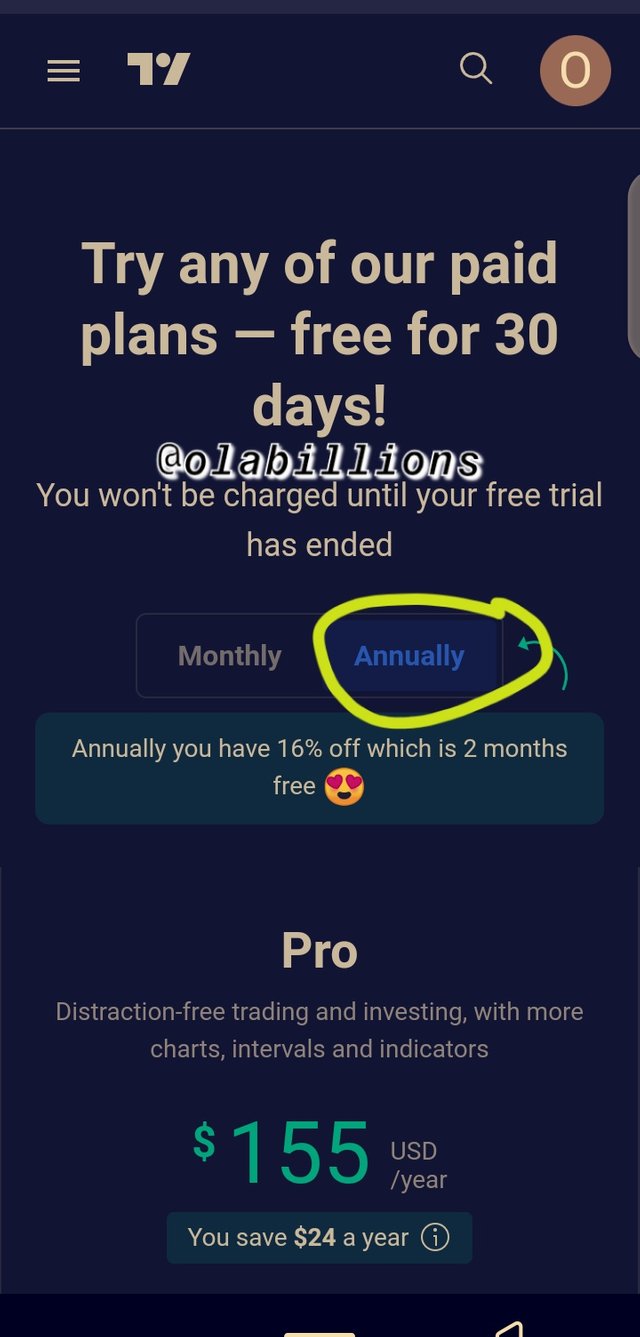
Annually plan
For pro = 155USD
For pro+ = 299USD
For premium = 59.95USD
In the screenshot you can see various benefit for different plans annually.
Question no 2:
Explain the different features of tradingView and what is your favorite feature and why?(screenshot necessary)
Trading view is a trading platform with numerous features, so let explore the different features of trading views..
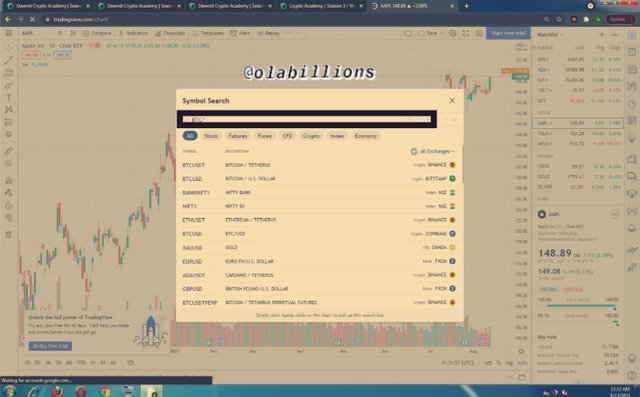
SEARCH SYMBOL:- In this feature, it enables user to search for the trading pair user tends to see, once user input the pair in the search space, it automatically show and user can click on it, then it display as a chart.
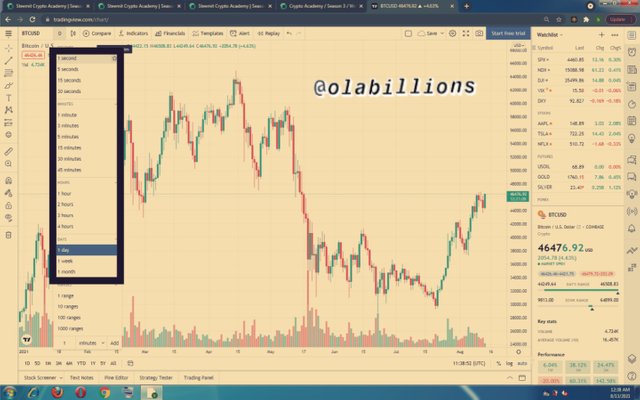
TIMEFRAME:- with this, various timeframe is available in this section, it could be sec, minute, hour, days, weeks, month, any of this timeframe is available depending on users trading style.
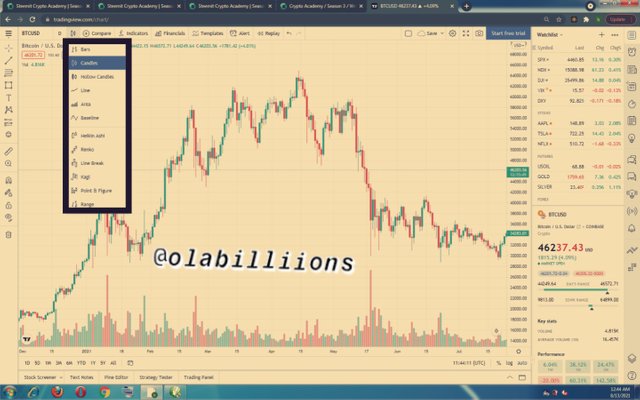
CANDLE FEATURE:- this feature comprises of several candle, of which bar candle is most commonly used among the many that is available. It can be changed to line, Japanese candle stick, hallow candle an so on, according to the preference of the trader.
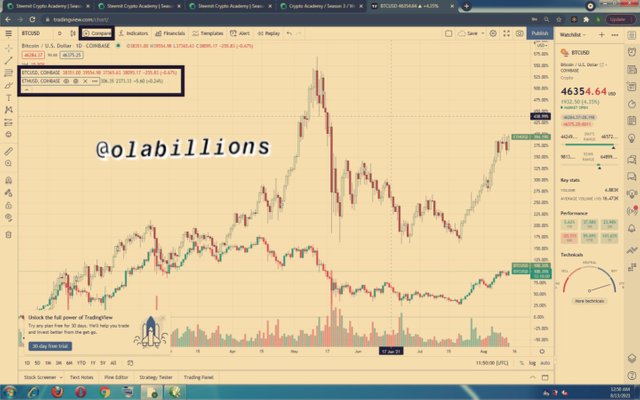
COMPARE FEATURE:- When trying to compare two market in a single chart, this feature is used to perform this action, just as the name implies, trader can compare two pairs of market in a single chart for analysis or other reasons.
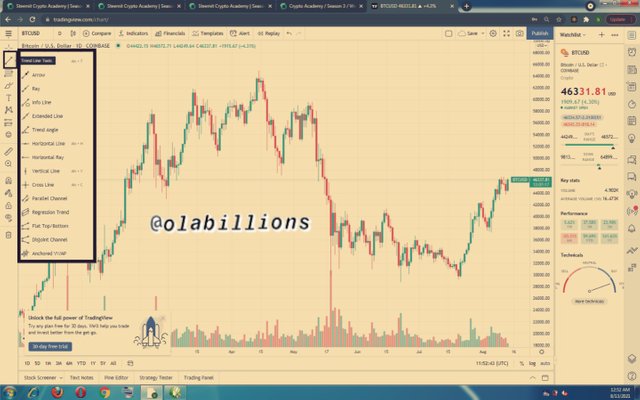
TREND LINES TOOLS in this feature, there are several trend lines tool used on chart in regard to users preference as such we have the horizontal lines, horizontal Ray, vertical lines, arrow Ray, Ray, extended line, trend angle cross line, parallel channel, disjoint channel and so on.
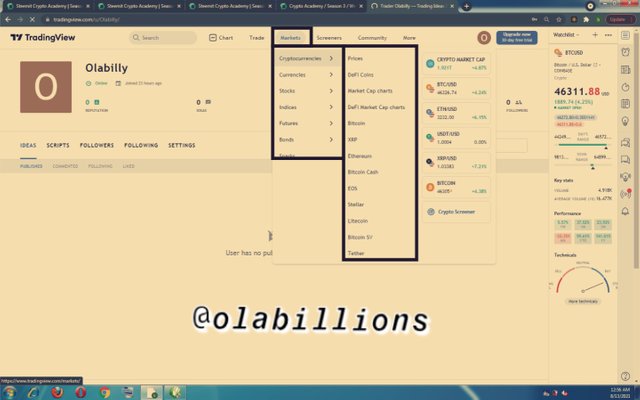
The market feature contains stock, cryptos, currencies, future, indices and so on. Each feature contains details that benefit traders.
Several information about this features are available in the market feature, for old and new information about currencies, indices, cryptocurrency, stock market can all be gotten in the market feature.
All the market feature has their respective sub features that will also helps users with information about the the market features in details. For example we have the cryptocurrency features which has features about, price the coin, DEFI coin, market cap chart, DEFI market cap chart and so on, therefore each of these features has a given information that traders can benefit from. like the current price of a coin, in which exchange it's been traded, the pair and what price.
Let check the details on LITECOIN, click on market, click on cryptocurrency, so easy you can find the coin litecoin, so click on it
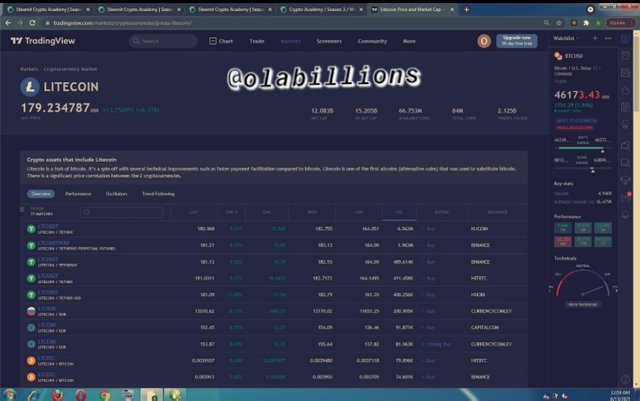
As we can see the above screenshot, we can see every details about LTC, valuable information is provided about the coin including different exchanges that the coin can be traded
In short, as said by the professor, market features give access to all famous financial market in the world.
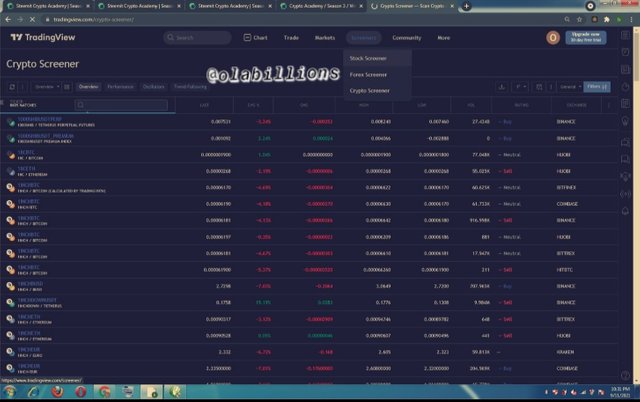
Screener has the stock screener, crypto screener and Forex screener, in this features, we can see the changes of each screener, like the volume of an asset as it changes, the sudden change in its high and low, the percentage change, its ratings and exchanges at which the asset is being traded.
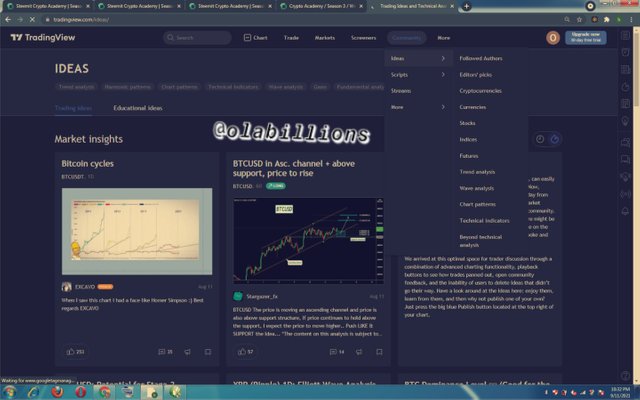
Another feature is the community where we have ideas, script, stream and so on. this feature idea is a part of the tradingviews features that I so much like because you will see different trading ideas about different market features. In short, Author give ideas about technical indicator, chart pattern, and trend analysis as such these idea can help build more knowledge in user trading skills.
We have the gann and fibonacci tools, cursor, shapes, icon, prediction and measurements, annotation tool and so on, there are lots of several features in the trading views website, on top panel we have the crypto pair, compare, indicator, financial, template, alert and replay and so on, we also have in the right panel, bottom panel feature and some of the features in the left panel as been explained.
MY FAVORITE FEATURE IS INDICATOR
In this feature there are several indicator that are used by adding to a chart, indiactor can be seen at the top panel of the chart, once you click on it, there is a search space to find the type of indiactor you want. Indicators are Bollinga band(BB), Relative Strength Index(RSI), Golden Cross and Death Cross(GC & DC), Moving Average(MA), Average Directional Indicator(ADI), Directional movement indicator(DMI), MACD, Stochastic oscillator and many more. This feature is my favourite because it gives user more insight into price trend and it make trading more clearer. It is an essential tool when trading.
Question no 3:
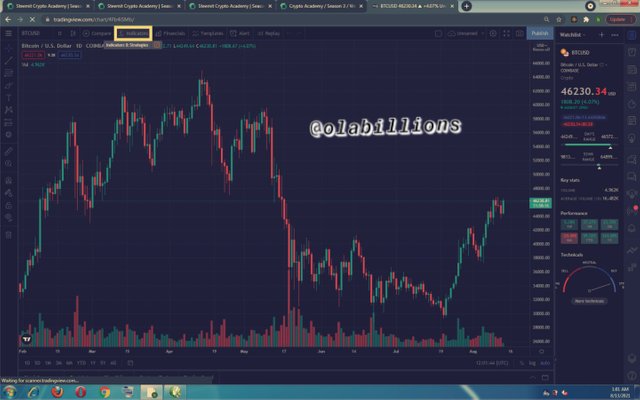
How to set up a chart in TradingView and use two tools to edit it.(screenshot necessary)
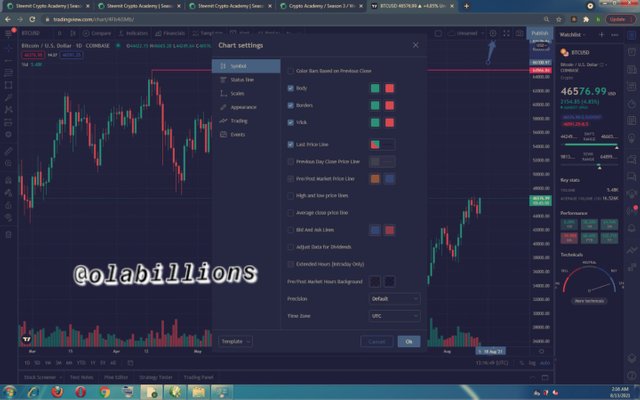
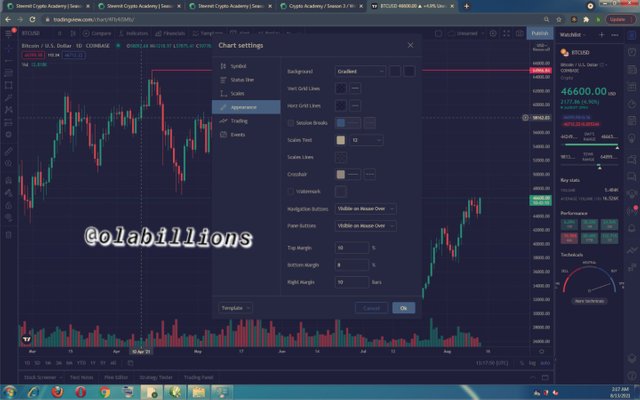
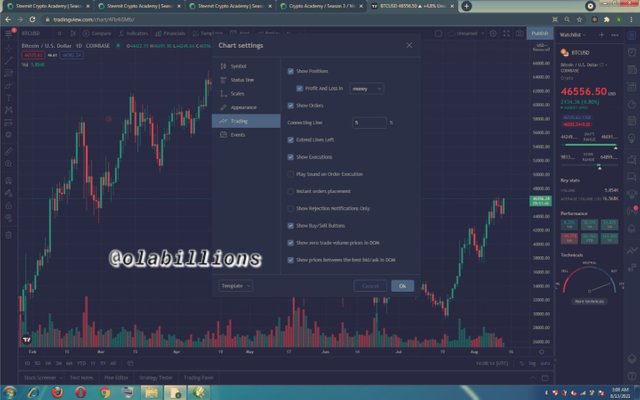
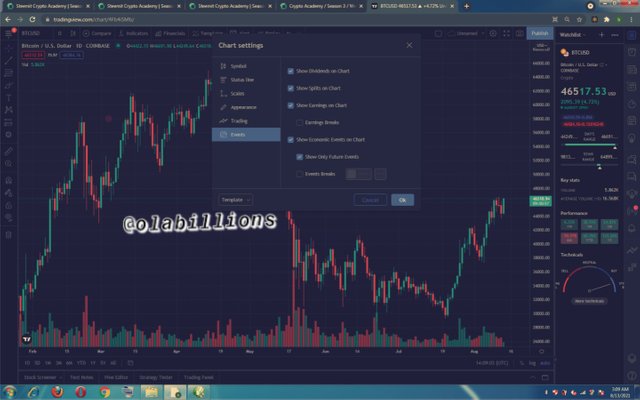
The trading views trading chart can be set according to user choice, to change/edit/set the trading chart, go to chart settings, which is located at the top panel at the right and then click on it as directed by the arrow, user can see the different options to set the trading chart, option like symbol, status line, scale, appearance, trading, event.
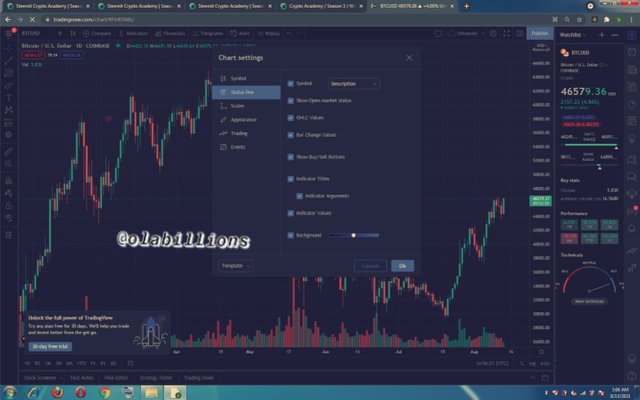

As seen, this features can be editted or changed, after changing it will have an effect on the trading chart as per user preference.
The symbol section contains styles that can be used to set body color, wick and borders.
In the appearance section, we can change the background of the chart, the color, vertical grid line and horizontal grid line.
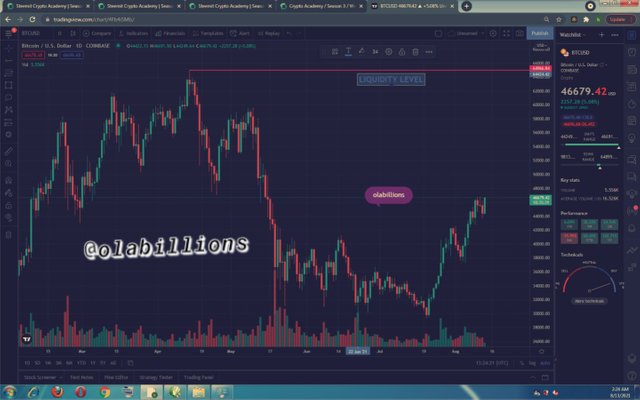
In this screenshot above, two tools were used which is the horizontal Ray, which I used In marking the liquidity level and also the text tool was also used including a callout used to watermark my username.
Question no 4:
Explain how to add indicator in chart, what is your your favorite indicator and why? (screenshot necessary)

- Launch the trading view website
- Click on chart and select the crypto pair of your choice.
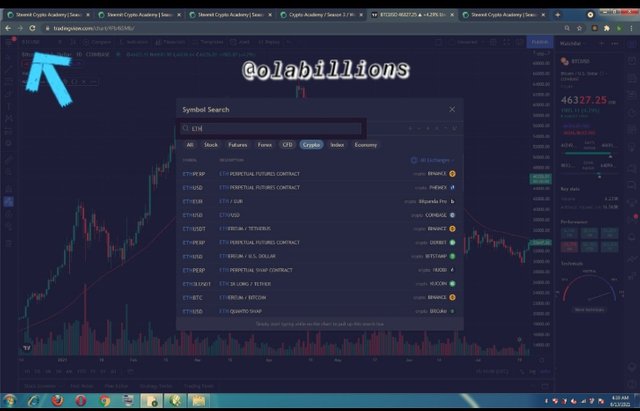
- At the top center of the trading chart you can find the (fx) symbol which stand for indicator, right click on it
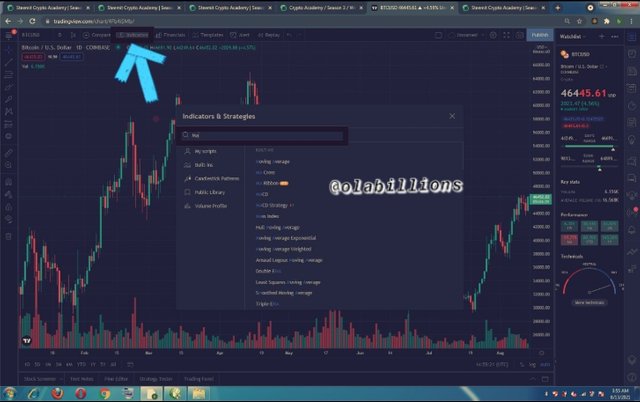
Then a pop up box will appear where by you input the indicator name, select the corresponding indicator as searched and it automatically add to the chart.
To configure the indicator, click on the indicator setting.
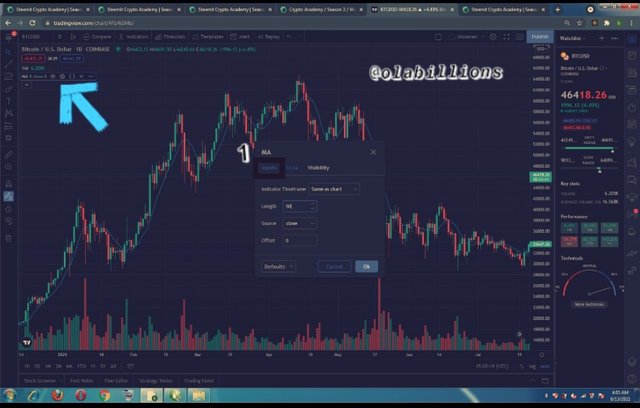
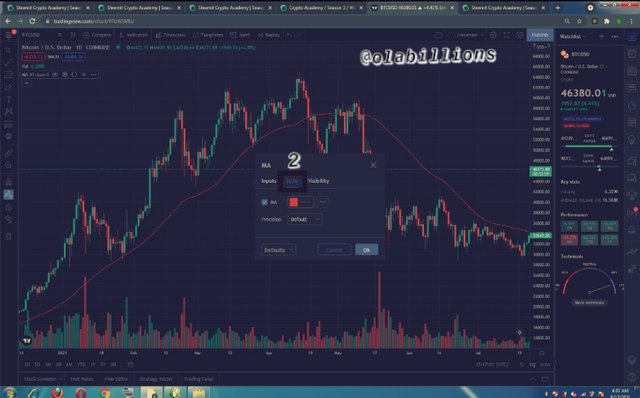
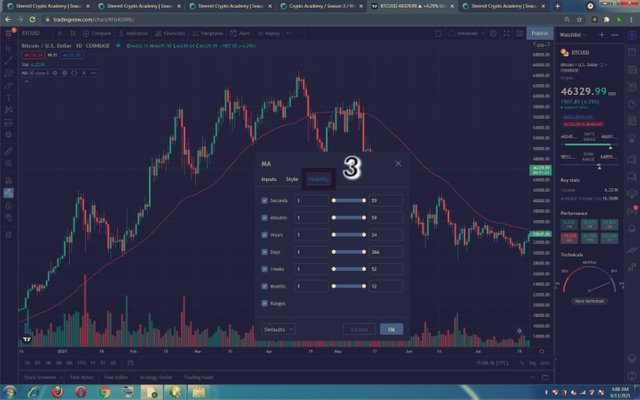
A small pop up box appears and we can see the input section where we can set the length period as per users choice. the next option in this pop up is style section where by user can set the color of the indicator or leave it as default. In the visibility aspect, we leave it as default.
My favorite indicator is the DC and GC indicator, I like this indicator because it indicate/predict market trend.
The DC which stands for death cross is an indicator that indicate when the market is moving in a downtrend while the GC known as golden cross indicate when the market is in an uptrend.
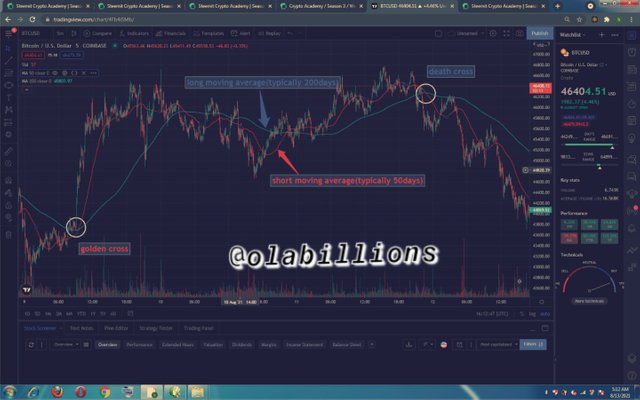
The DC shows a pattern that signal a bear in the market when the long MA crosses (typically 200 days)the short MA(typically 50days) from above, this signals massive take profit from investors selling their position,thereby decreasing the value of the asset, while the GC signals a bull run in the market, which mean that investors are accumulating more asset which tend to increase the value in price of the asset and this can be identified when the short MA(typically 50days)from below crosses above the long MA(typically 200 days).
Question no5
Do you think TradingView is useful in predicting the market for cryptocurrency (trend / price)?
Trading views is a very useful trading platform that is not only useful in the market for crypto only but also for stock and commodities, trading views help traders make profit through various features that it has.
Tools like trendlines are useful when drawn on a chart to mark support and resistance level, this tools can be used to mark the current market trend, liquidity level, breakout and so on.
Indicators like ADX can be used to know the strength of the market trend and DMI can be used to know the direction of the market, the combination of ADX and DMI indicate trend strength and market direction, the prediction of crypto price can be done in trading views with the use of indicators like RSI, Stochastic oscillator, which indicate overbought and oversold asset.
Question no6
Conclusion
Tradingview is an online trading platform that presents a wide range of features used in trading and it also contains information about financial market of the world, it gives current price and news about financial market and cryptocurrency, ideas from different user and information from different authors as regard trading. it's opportune trader to use for free. in this class I have learnt a lot with the help of professor @yousafharoonkhan lecture and I have added more knowledge to what I already know about trading views.

Respected first thank you very much for taking interest in SteemitCryptoAcademy
Season 3 | intermediate course class week 7
feedback
GC and DC are also my favourite and you explained very well
your homework is well written and thank you very much for taking interest , keep continue good work ,