Crypto Academy Week 12 - Homework Post for professor @Kouba01 on Cryptocurrency trading with RSI
What is the Relative Strength Index - RSI and How is it Calculated?
Technically, traders find a way to make their buy or sell option in the market, many indicators are available for use which differs in methods, trader tends to go for the versatile indicators to enable them detect their entry or exit in the market, there in comes the RELATIVE STRENGTH INDEX which is one of the most preferred indicators used by traders which makes it important in trading successfully.
The relative strength index also known as RSI is a tool used buy traders like many other trading tools, it measures or determine wether your asset is overbought or oversold, with help of RSI a trader can get a better entry and exit point and thus, increase in an asset values rises when the RSI is above 50 over a period of time and when dips a recorded its below 50 during this period, RSI ranges from 0 to 100, but when we see an asset with an overbought signal definitely the RSI is above 50 but ranging from 70 to 100 and then if the asset is oversold it also below 50, but here we recorded more steep dips making it ranging from 0 to 30 according to professor @kouba01, RSI has been in existence since 40years ago, created by a technical analyst named WILLIS WILDER, the professor also went heard stated that the RSI can be calculated as
RSI=100 - 100/(1 + RS)
RS which mean average earnings over a high period over a given period / Average loss over a high period during this period
Can we trust the RSI on cryptocurrency trading and why?
I wouldn't say we can or we can't because RSI also could give a false signal of an overbought or oversold asset, whereas the chart says otherwise, more reasons why it should be supported by other indicators like STOPLOSS, there are pros and cons to this indicator, analyst should be able combine other indicator with the RSI and a better trading experience to give a 100 percent sure signal, in this case RSI could be trusted and trader can go ahead with their entry or exist..
How do you configure the RSI indicator on the chart and what does the length parameter
Since I don't have a desktop or laptop, I will be using my binance app
- Login in to your binance app
- Select market
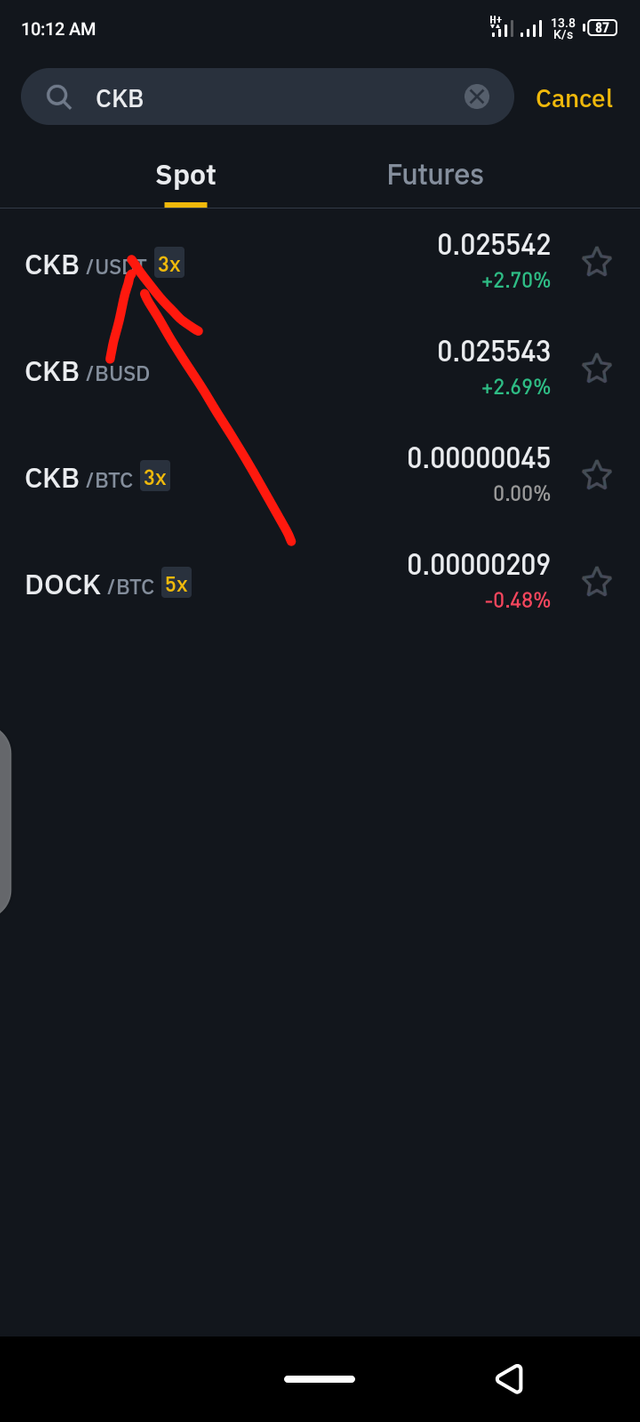
- Here you insert the pair of coin you intend to us, let's say CKB/USDT
- It automatically review the chart you selected
- In binance the function are easy as you will see the RSI beneath the chart, here are screenshots of the aforementioned procedures.
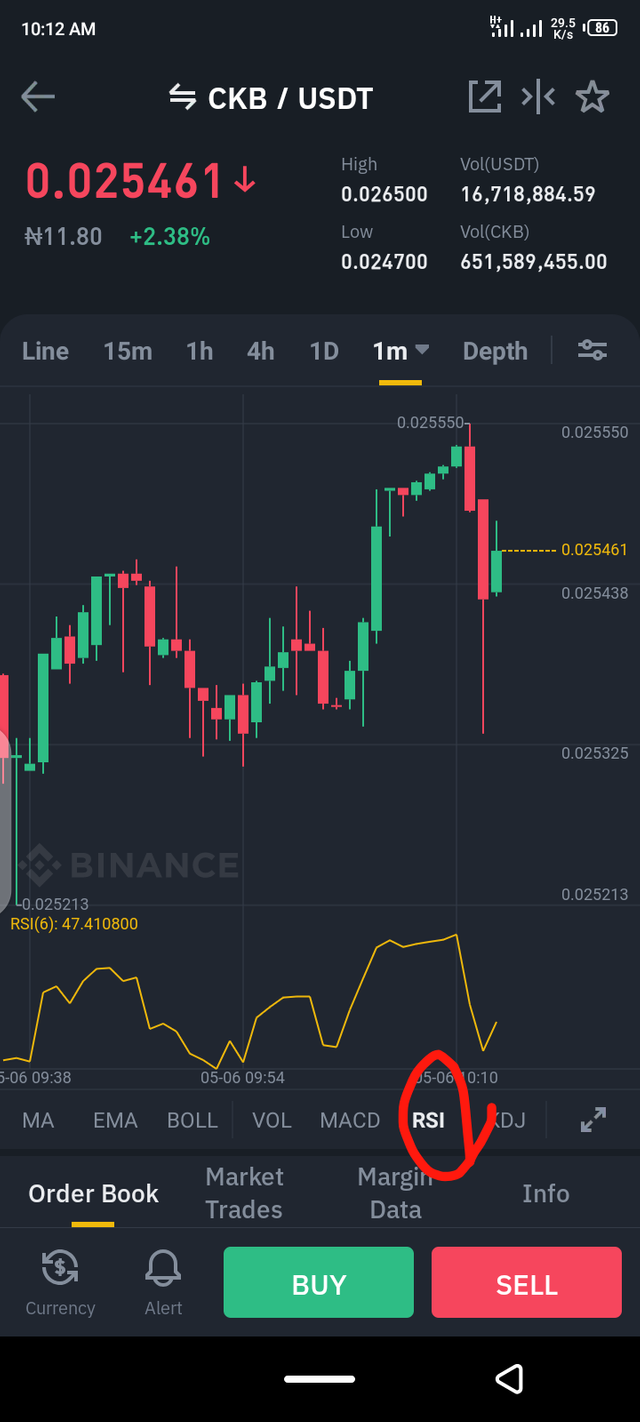
Although the options are not seen but I already learn from the professor's lecture that its has the input option and the style of which these options have it's own window.
In the input window is where you find the length, the RSI default length is 14, whereby it is an important parameter of the RSI chart, the length of RSI depend on the number of unit selected, for example if the last 14 hours RSI is formed definitely the time frame chart selected is 1hour and if its a 1 day time frame selected the RSI forms the last 14day, a week time frame is selected RSI of 14 weeks will be formed.
The length parameters default is known to be 14 it can also be changed to any unit of your choice eg 10, 9, 8 and so on.
since binance doesn't show the length option I took time to download another application in satisfactory of the professors questions.
Here as an app called olymp trade
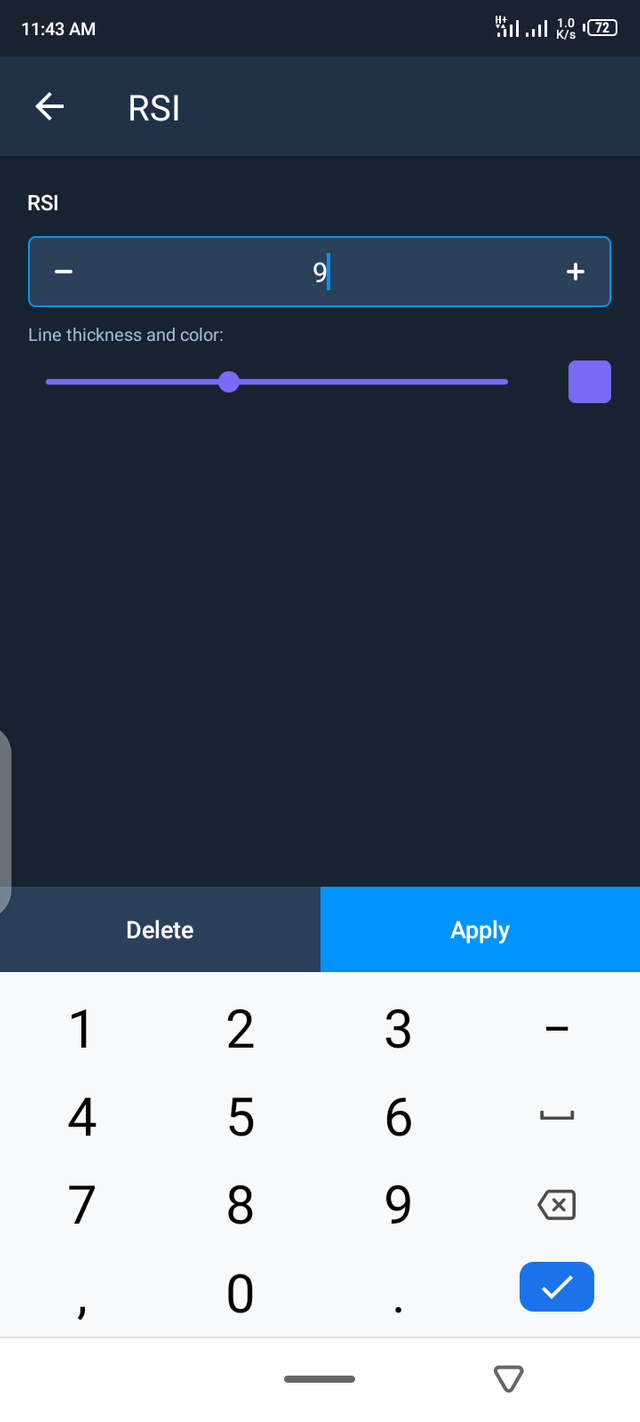
Here you can see the changes in length of the RSI,
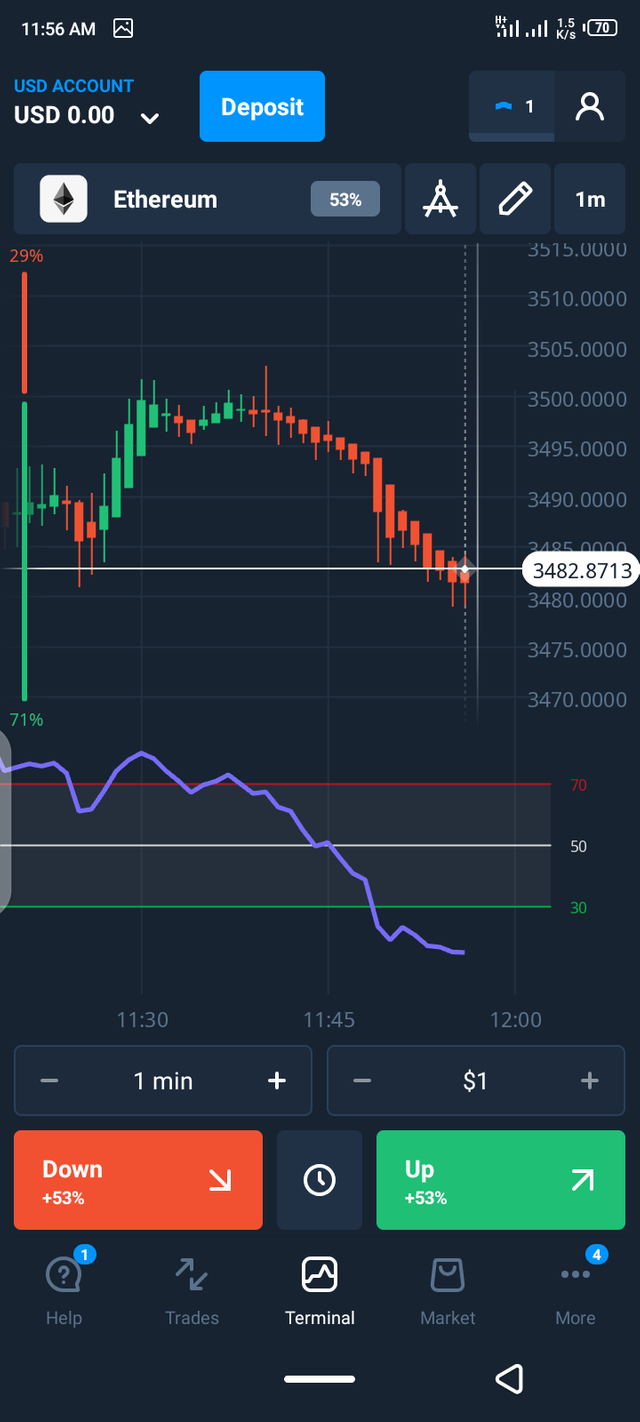
In a 1 minute time frame chart so that the price movement of the asset will be shown by the RSI indicator for the last 14min.
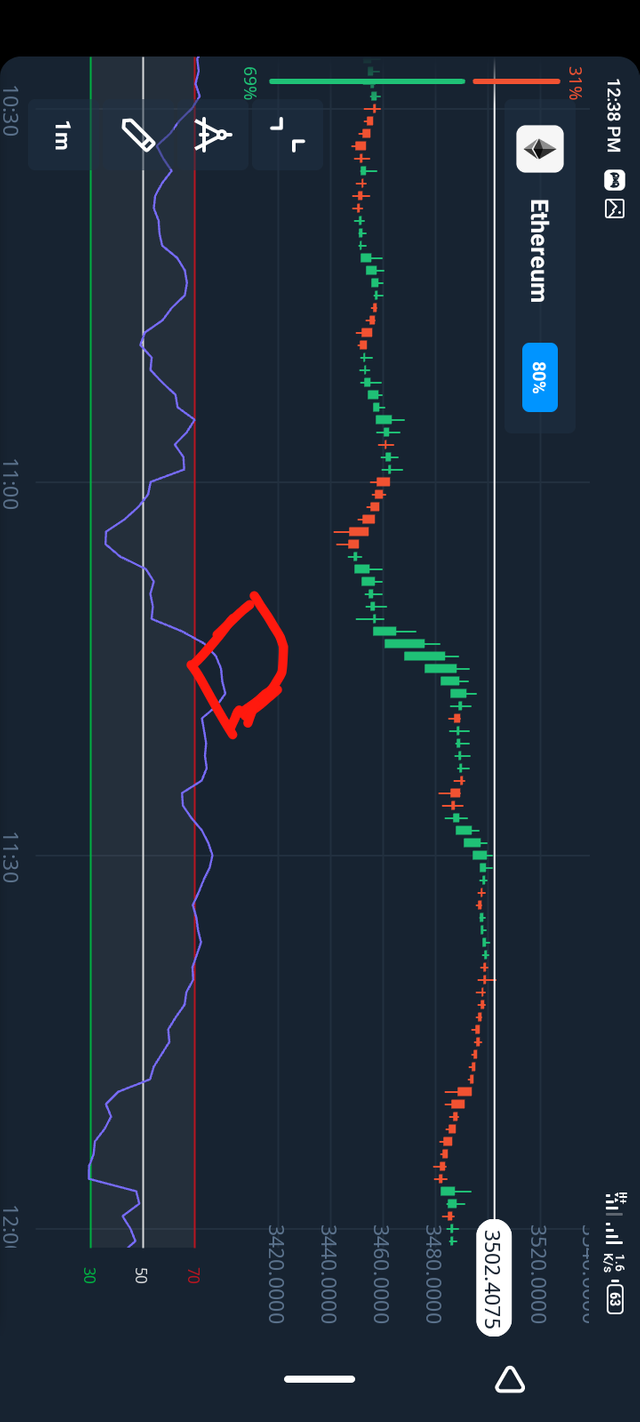
How do you interpret the overbought and oversold signals when trading cryptocurrencies? (Screen capture required)
 (overbought)
The interpretation of an overbought signal as RSI is concerned is that when the demand exceed supply more than the normal upward price of an asset is said to be overbought, the normal high of an overbought signal on the RSI chart is the 70level but when the signal crosses above that level ranging from 70 to 100 then an asset is said to be over bought.
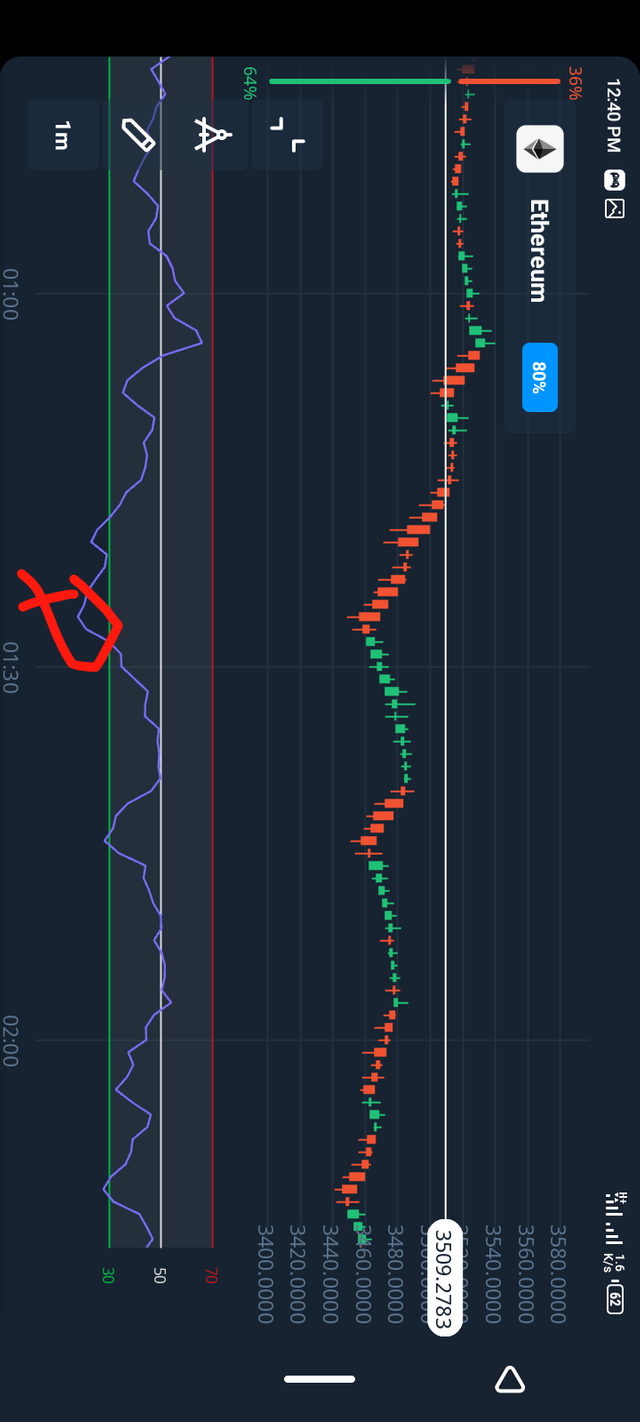 (oversold)
Oversold is the vice versa of overbought, when the price of an asset go lower beyond the normally low which is 30 on the RSI chart the asset is said to be oversold (buy), in other words when supply exceeds demand such that the price becomes lower than 30 then an asset is said to be oversold ranging from 0 to 30
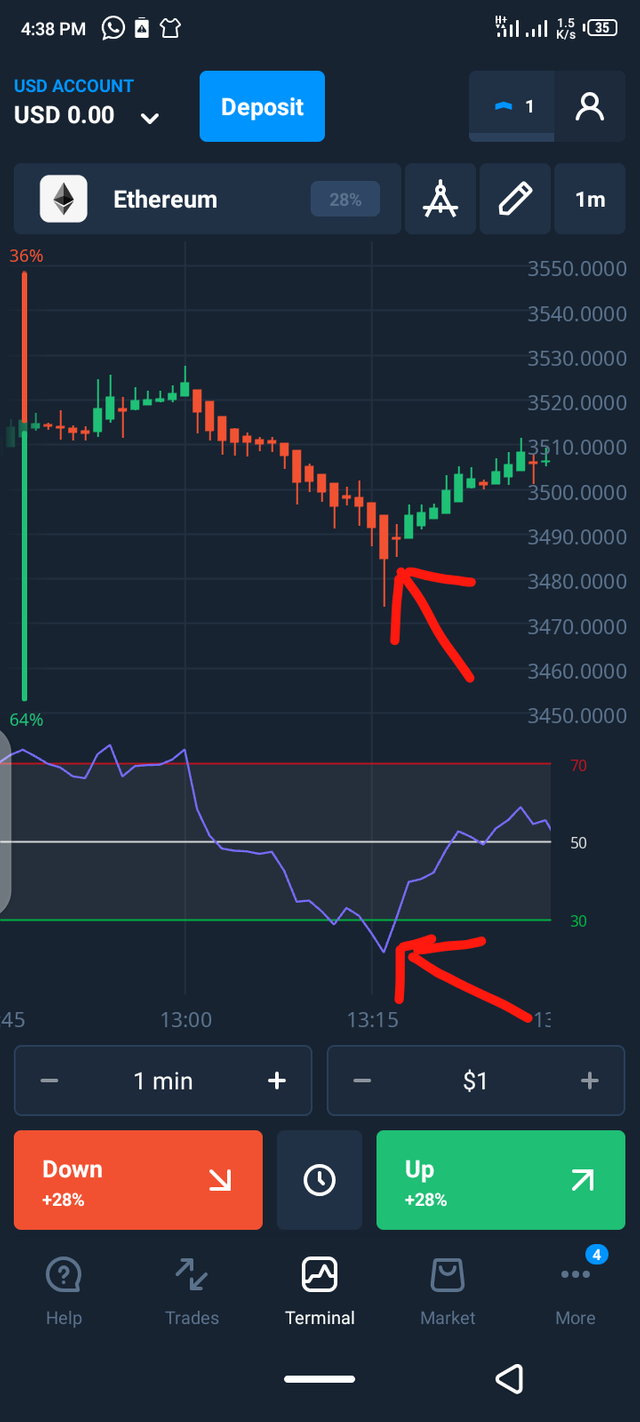
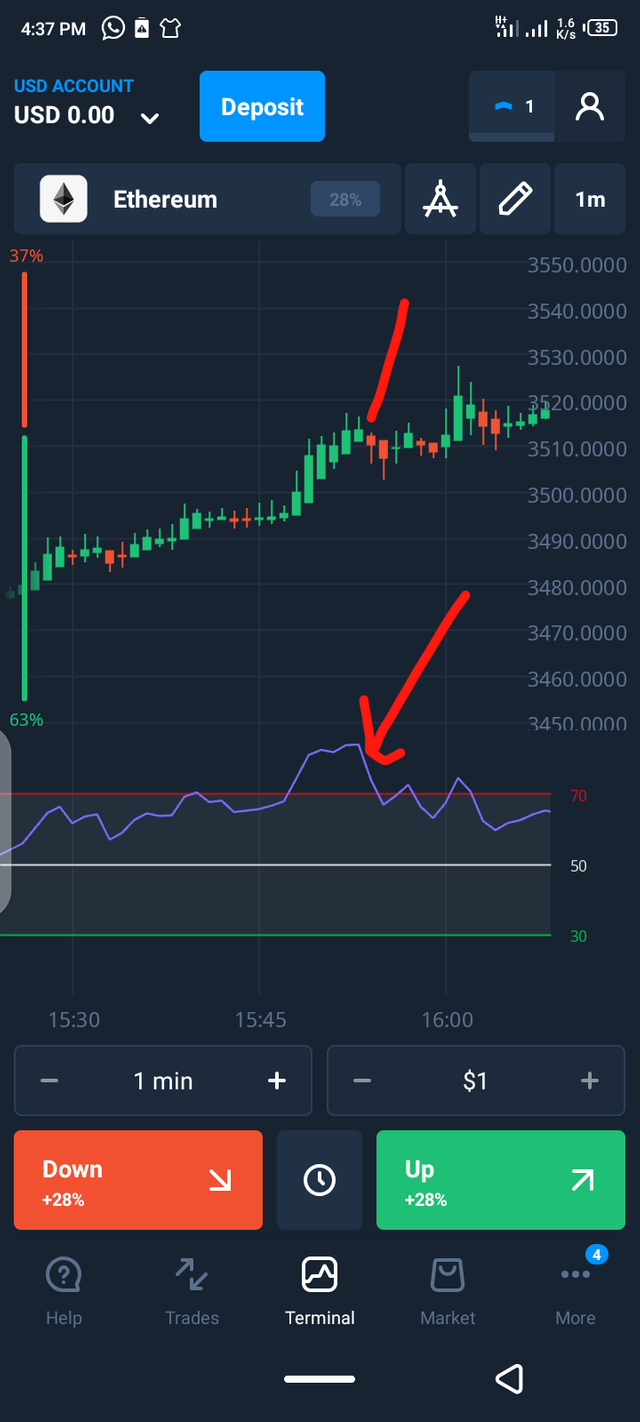
How do we filter RSI signals to distinguish and recognize true signals from false signals. (Screen capture required)
Apart from looking for overbought and oversold signal with the use of RSI, RSI divergence is also a way to get active signal before losses occur, normally when the price of an asset record a pattern like high or higher high, It could be low or lower low the RSI is suppose to be in line with the price Patten but when the RSI chart says otherwise therein comes the divergence which could be bullish and bearish.
To filter RSI signal one need to combine RSI with other oscillators like MACD, Stochastic and so on to see if the signal are not false signals, the market condition could cause a false signal The filtration of recognizing false signal from right signal can be filtered through divergence,
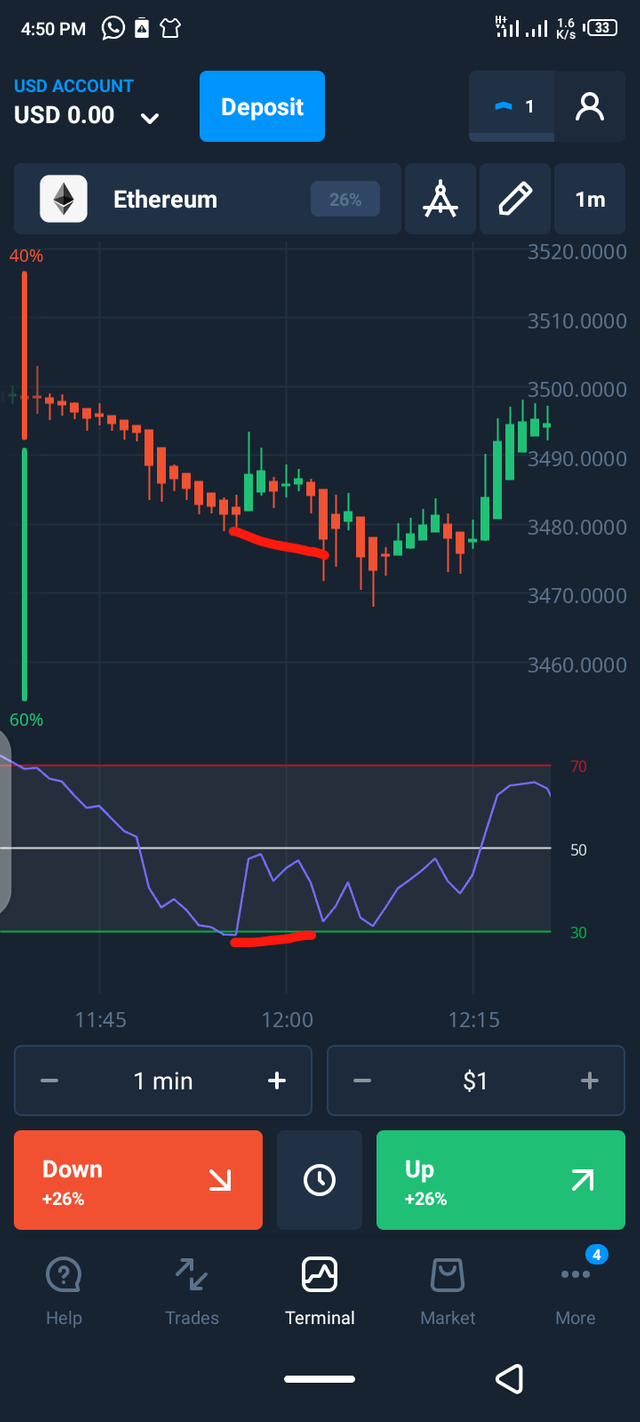
Bullish divergence as stated by the professor occurs when the price of an asset is falling, given rise to a pattern known as dips, which is bearish but the RSI mark a higher low. it is a strong signal for market reversal and it's more relevant when it occurs in the oversold zone.
Bearish divergence is when the asset peaks higher and the RSI marks lower and it is more relevant when it occurs in the ovebought zone, both indicators shows that they are both price reversal if traders can find or spot them, there is assurance of securing more gain than loss.
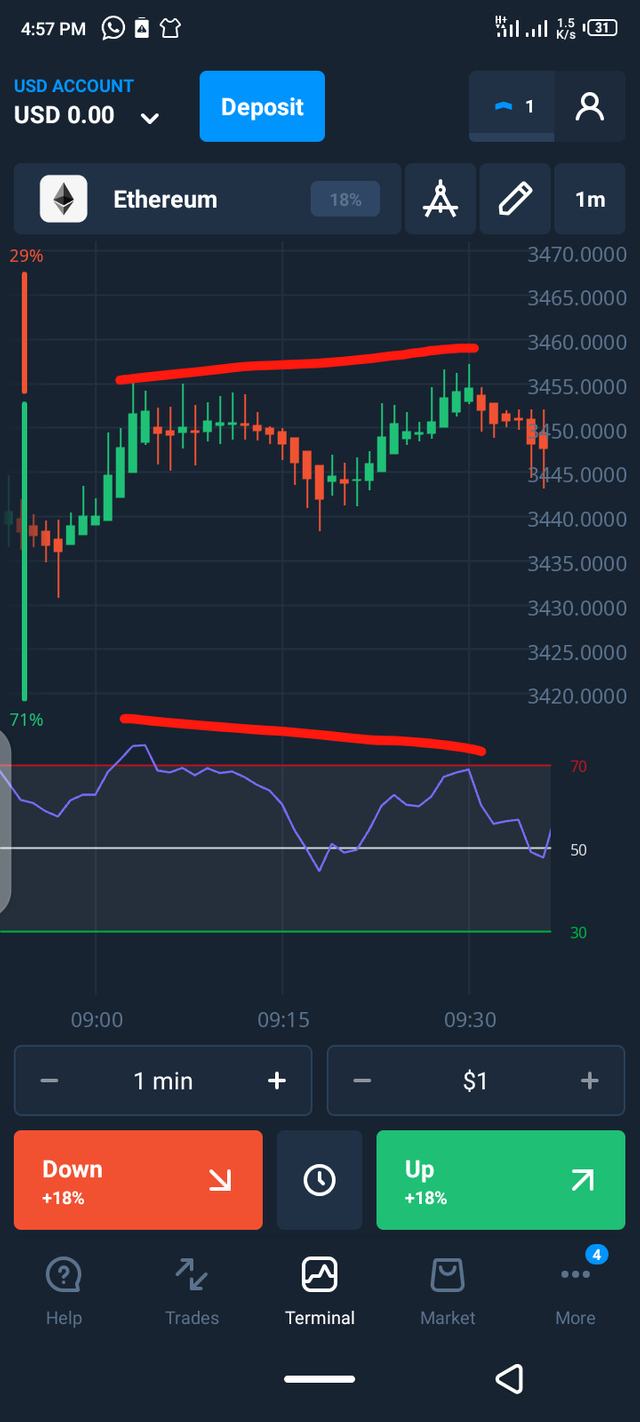
Review the chart of any pair eth/usd and present the various signals from the RSI. (Screen capture required)
The screenshot above shows that the RSI crosses to the oversold zone which is below 30 given a chance to buy.
Here above is where the RSI crosses above the 70 level given an overbought sign.
Conclusion :
Thank to the professor @kouba01 I have been able to learn and understand the Relative Strenght Index through the lecture.
- Regards:
Cc: @kouba01
Hello @olabillions,
Thank you for participating in the 4th Week Crypto Course in its second season and for your efforts to complete the suggested tasks, you deserve an 8/10 rating, according to the following scale:
My review :
A well-content article accurately demonstrating your understanding of the questions. For the last question, you had to analyze further price change by adding other signals and not just being oversold and overbought.
Thanks again for your effort, and we look forward to reading your next work.
Sincerely,@kouba01
I will put more effort next time. Thanks for the review