Crypto Academy Week 14 | Homework Post for @kouba01
Hello everyone welcome to my 3rd homework of this week cryptoacademy homework were we will be looking at Trading with the MACD indicator which was given by @kouba01 any way let's begin.
The MACD can be define as the indicator that is most of the time used by traders in knowing the direction and strength of a trend, predicting potential market price reversals and the potential entry and exit trade positions.
Comparing the IRS i noticed that the MACD indicator is better, the reason is because it is the combination of various indicators(signal line, MACD line and histogram which aid an investor in making a more strong judgment in his day to day crypto trading.
What is the process to add MACD indicator to the chart, what are its settings, and ways to benefit from them? (Screenshot required)
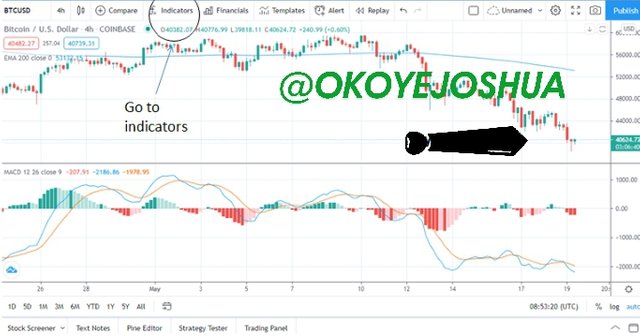
In this article i used the BTC/USD chart To add the MACD trading indicator;
Just go to the indicator option which at the top bar of my trading chart.
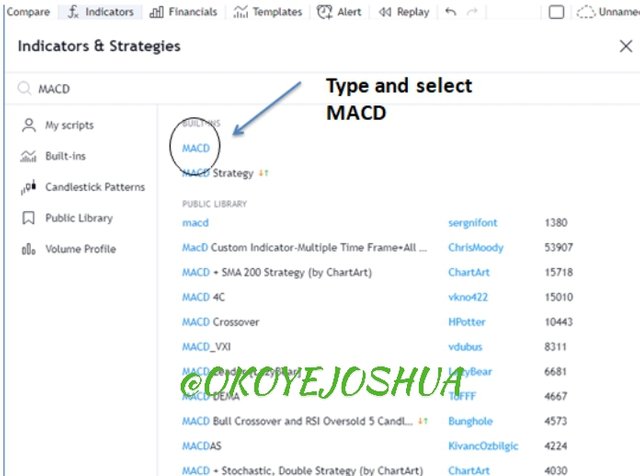
Type in MACDin search button and click it
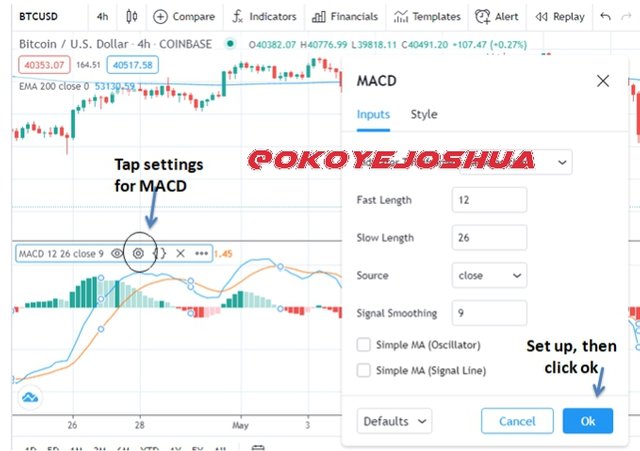
Set MACD up - 12 ,26 ,9
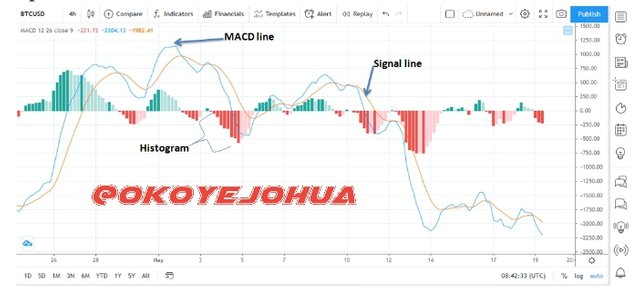
The Signal line
It is set 9 simple moving average by default it is known as a very fast moving average meaning it react faster to price action of any price action This gives a trader with a speedier signal in respects to the course of the trend. It acts as a first indicator within the MACD. In any case, it’s utilized in connection with the MACD line. occasionally the crosses underneath or over by both MACD line and Signal line shows a reversal signal of the market.
MACD line
This can be obtained through the difference in short term moving average and the long term own For instance 12EMA – 26EMA = MACD line. In other words, the MACD line is a combination of 2 EMAs (12EMA and 26EMA).
The Histogram
Bar charts is what this can described as in the MACD line You can notice it close to the zero line. What is its extract? The histogram simply display the differences between the MACD and the balance lines. This meansTraders can easily identify the trend by simply looking at the formed bar charts whether the uptrend or the downer side for the downtrend.
Explain how to use MACD with crossing MACD line and signal line? And How to use the MACD with the crossing of the zero line?
The MACD line and Signal line Crossing in the screenshot below
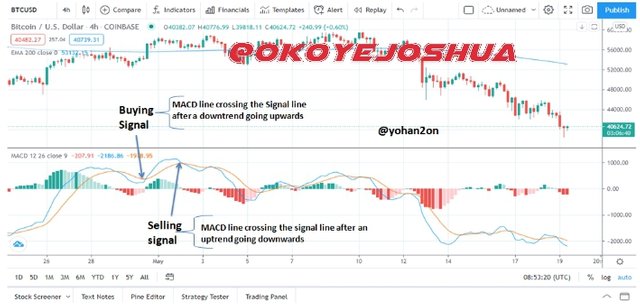
When the line that is known as MACD crosses the single line from a downtrend that has beem going on to the uptrend this signifies to us a buying signal. On the other hand, when the MACD line crosses the Flag line from a continuing uptrend, this means to us a sellout
.
MACD line crossing the Zero line
This happens when the MACD crossing the zero line which it signifies a sell signal. On another hand, when the MACD line crosses the zero line proceeding upwards, it signifies buying a signal.
The way in detecting the trend using using the MACD? And how to filter out false signals? (Screenshot required)
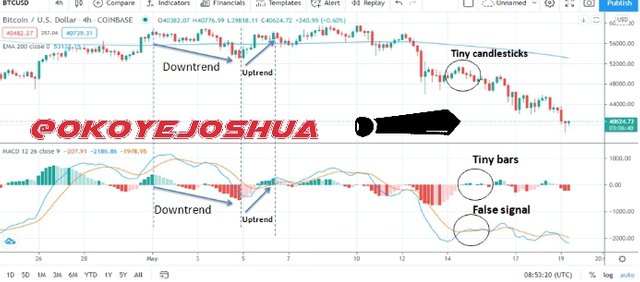
When using MACD, you can detect a bearish trend by first looking at what the bar chart is indicating which is showcase on the Histogram, because in life what ever goes up must come down, so we can use this to our advantage by using the Histogram to capture a trend reversal, when the reversal is happening the bar chats
appear swoon suggesting that the market is tired of going in that specific course; it, subsequently, starts off another trend. If typically well understood , you can capture a trend very early and make some good profits.
Explain How To Filter False Signals
It is said to not be smart in relying on one indicator when trading such as the MACD as these sometimes give false signals. So the process of filtering out false signals through the use of other indicators such as the price action (candlesticks). When you notice small candle stick forming you have to be careful with your trade decision at that period of time. That would just signify to you that it’s a fake-out. Here the market can either go up or downwards.
You can also know that false signals by looking at the size of bar chats displayed on the histogram. In the event that they are too little, at that point that would certainly be a false signal.
How can the MACD indicator be used to extract points or support and resistance levels on the chart?
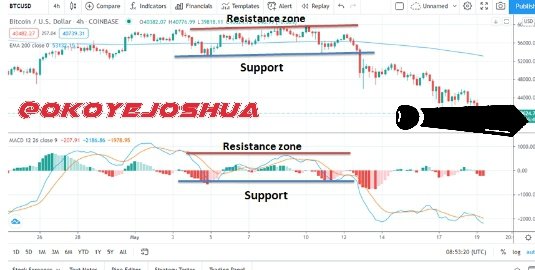
At the highest high of the histogram for instance below the zero line, it formulates a support point and at the highest high of the MACD line, the MACD forms a resistance point.
Conclusion
MACD indicator is one of the best indicator to use when you are ready to ride the chart wave by buying at the support and selling at the resistance which is good but make sure you always work with more than one indicator you understand to help you more any way thanks for reading @kouba01
Hello @okoyejoshua,
Thank you for participating in the 6th Week Crypto Course in its second season and for your efforts to complete the suggested tasks, you deserve a 3/10 rating, according to the following scale:
My review :
An article with sub-standard content, your thoughts are scattered, not rising to form an integrated paragraph, the lack of analysis in the answers and also you did not make the last question.
Thanks again for your effort, and we look forward to reading your next work.
Sincerely,@kouba01