Ultimate oscillator indicator- Steemit Crypto Academy- S5W8-Homework post for @utsavsaxena11.


(1) What do you understand by the ultimate oscillator indicator? How to calculate the ultimate oscillator value for a particular candle or time frame. Give a real example using chart pattern, show complete calculation with accurate result.
(2) How to identify trends in the market using an ultimate oscillator. What is the difference between the ultimate oscillators and slow stochastic oscillators?
(3) How to identify divergence in the market using an ultimate oscillator, if we are unable to identify divergence easily then which indicator will help us to identify divergence in the market.
(4) what is the 3 step- approach method through which one can take entry and exit from the market. Show real examples of entry and exit from the market.
(5) What is your opinion about the ultimate oscillator indicator. Which time frame will you prefer how to use the ultimate oscillator and why?
(6) Conclusion
INTRODUCTION: Good day Steemians, I am @ojerindejoel from the Steemit crypto academy, I wish everyone complement of the season and a happy new year, I will be writing an assignment on Trading with Ultimate oscillator lectured by @utsavsaxena11.

Ultimate oscillator indicator is developed by Larry Williams in 1976 to calculate the momentum of the market price in any cryptocurrency asset in any time frame.
This indicator is very useful in trading because it has low volatility and it does not provide many signals like some indicators that provide so many signals in which many might be a false signal, but ultimate indicator provides fewer signals which are more accurate.
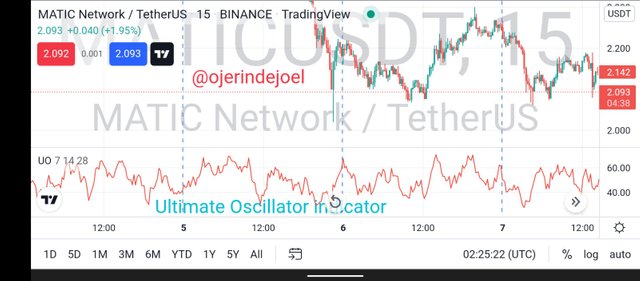
The Ultimate indicator is more effective in lower time frame because at the lower time frame more detailed information is given about the market price than the higher time frames, this indicator is just like a stochastic indicator its ranges from 0 to 100 and it has an overbought zone from 70-100 while the oversold zone ranges from 30-0 in which this zone can be used to determine trend reversals either bullish or bearish reversals.
HOW TO CALCULATE THE ULTIMATE INDICATOR
To calculate using the ultimate indicator we have four major things to consider while doing these calculations.
- Ultimate oscillator
- Buying pressure
- True range
- calculate average of period 7,14 and 28
Let's take them one after the other
BUYING PRESSURE (BP)
Buying pressure is the closing price of a period low and we are to calculate all the buying pressure for all the periods which are periods 7,14 and 18, which will be summed up to serve as our buying pressure sum.
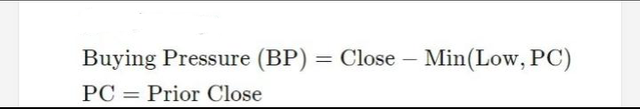
- Closing price
- Minimum price
- Prior close (PC)
TRUE RANGE
True range is the difference between the maximum high or prior close and minimum low or prior close of all the periods 7,14 and 28 which will be summed together to serve as true range sum.
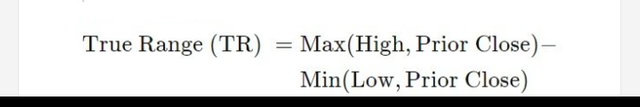
Making use of the formula and its parameters we'll get our TRUE RANGE
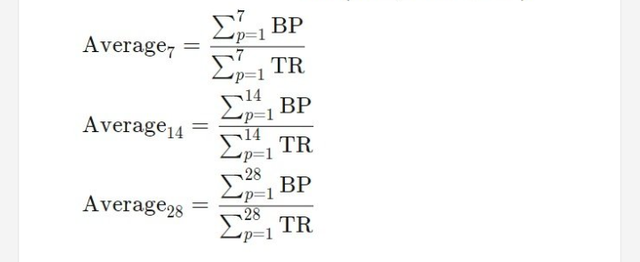
AVERAGE 7,14 AND 28
To know the average of all these periods we need to divide the sum of buying pressure of a period by the sum of the true range of a period which will give us the particular average for that period and we will do the same thing for all the periods.
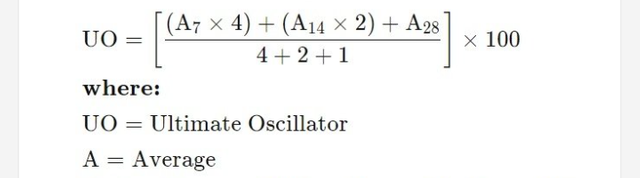
ULTIMATE OSCILLATOR
The ultimate oscillator is calculated using the averages of periods 7, 14, and 28 in which period 7 has a weight of four, period 14 has a weight of 2, and period 28 has the weight of 1 in which the sum of all these weights will serve as a denominator for calculating the ultimate oscillator using the formula below.
Identifying the market trend using the ultimate oscillator is very day to know because it uses ranges of 0 to 100 like other oscillators and it has an overbought region and an oversold region with this, we can identify the trend of the market price.
What we need to do is to watch the market closely and be patient, as soon as we notice that the market price has gotten to the oversold region which is 30-0 we have to be patient for the price to make a U-turn around region 15-5 so as not to fall a victim of fake-out then we know that an uptrend is about to start.
Similarly for a downtrend just vice versa, we need to allow the market to get to the overbought region which is 70-100 as soon as the price gets to this range, we will have to be patient for it to have a U-turn around 85-95 region so as not to fall a victim of fake-out, then we will be assured that it's a downtrend.
DIFFERENCE BETWEEN ULTIMATE OSCILLATOR AND THE STOCHASTIC OSCILLATOR
| Ultimate oscillator | stochastic oscillator |
|---|---|
| It consists of periods 7,14 and 28 | It consists of 14,1 3 periods |
| contains only one line | contains two lines the fast line and the slow line |
| Can be used with the principle of divergence and convergence | can be used with other indicators |
| Can be used in multiple timeframes | cannot be used in multiple timeframes |
Firstly, we need to know the meaning of divergence, divergence is the separation between two-point or separation between a group of confluence. Now coming to the crypto community ** we experience divergence when we combine two indicators together in which both are reading different meanings but still heading towards the same direction.
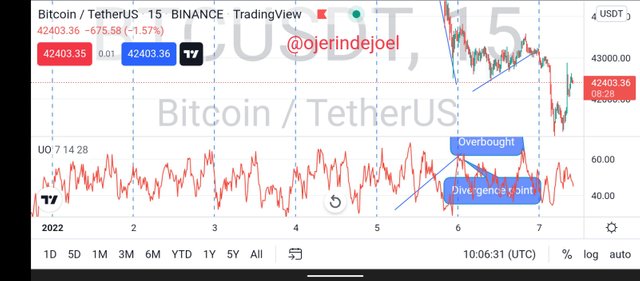
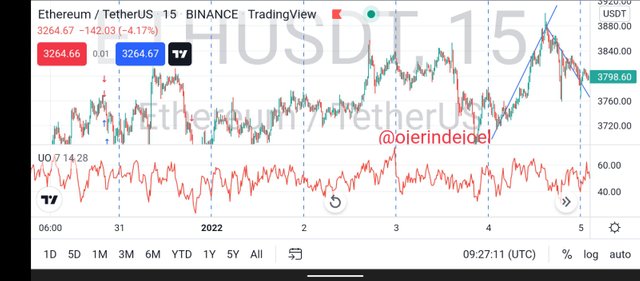
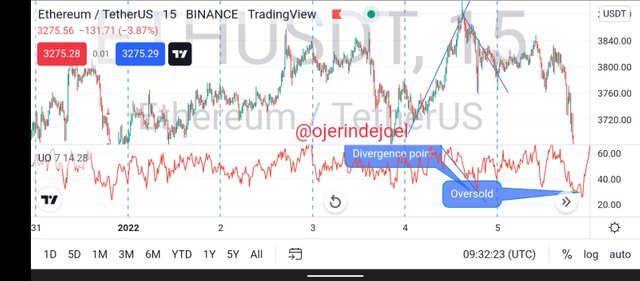
How do we now identify the divergence using the ultimate oscillator for a sell signal what we need to do is to notice when the chat is about to have reversed at the higher highs on the market chart and then we reverse at the lows which is the oversold region of the ultimate oscillator by so doing we have a divergence.
Similarly for a buy signal but in the reverse Manner of the sell signal, when we have a reversal at the lower lows of the market chart and we have a high on the ultimate oscillator which is the overbought region, with these two signals we have our divergence.
Indicator that can help in knowing divergence
MACD (moving average convergence divergence)
MACD is a strong indicator used for knowing the momentum of the market and it also helps in knowing the divergence of the market as the Price makes moves.
We have three major steps for taking market entry and exit using the ultimate oscillator which we will be looking at one by one.
Bullish entry and exit
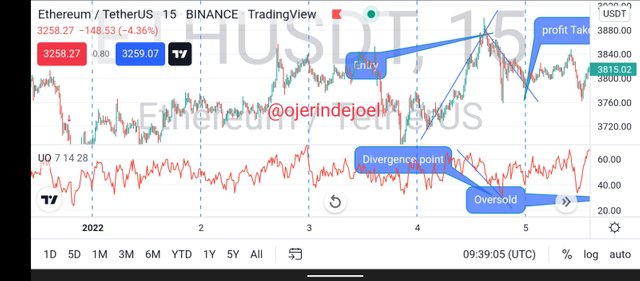
- Firstly, we need to confirm the bullish divergence on the market chart by making a lower low and when the market makes a higher high on the indicator which is at the overbought
- Secondly, we much make sure the first low of the divergence is below the 30, this is telling us that divergence started from the oversold region and a bullish is bound to happen from there.
- Thirdly, this is the last step that has to be considered in using the ultimate oscillator, The ultimate oscillator has to rise above the divergence high, this high can be referred to as the highest point between two lows of a divergence.
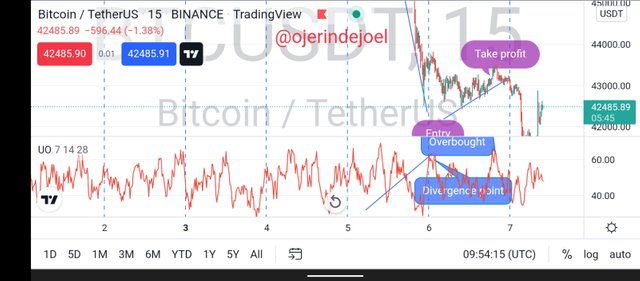
Bearish entry and exit
The bearish entry and exit take the same step but just in a reverse manner.
- Firstly, we need to confirm a bearish divergence on the market chart, that is when a price makes a higher high on the chart and makes a lower low on the ultimate oscillator indicator.
- Secondly, we must make sure the first high of the divergence is above 70 which is indicating that the divergence is starting from overbought and giving us a signal that a bearish reversal is bound to happen soon.
- Thirdly, the last step before taking our entry is that the ultimate indicator has to drop down below the divergence low and the divergence low can be referred to as the lowest point between two highs of a divergence.
Ultimate oscillator indicator is an indicator that shows less complexity, it is very easy to understand, and the analysis is straightforward, it does not give so much signal that's why most signals we get from this strategy are accurate most times and it has low volatility.
The ultimate oscillator indicator is a very useful tool in short-term trades because the lowest period which is 7 has a strong weight. And. trends of the market can be easily identified using this indicator and the three-step verification helps us to be sure that we are getting the right direction.
What timeframe will you like to use when using the ultimate indicator and why?
- I will like to use the lowest timeframe
Because it gives more accurate information about the market price using the current time of the market in its calculations and I personally I will like to scalp the market for a short time because I might not have to a whole day to check chart frequently

CONCLUSION
Conclusively, the ultimate oscillator indicator is a very useful tool for trading crypto though it has limitations it advantages is more than its limitations and ultimate oscillator works are unique, very easy to comprehend and its steps of analysis are very straight forward and again the principle of divergent makes it more accurate in determining some fact about the market.
The ultimate oscillator has low volatility and it gives few signals because many of the signals can lead to fake out and loss of money, I personally will like to use this indicator for stochastic oscillators because of its flexibility.
I wish you a happy holiday @utsavsaxena11.
NB: screenshot without source from trading view