Steemit Crypto Academy Season 5 Beginner Course - Task 10: Candlestick Patterns
a) Explain the Japanese candlestick chart ? (Original screenshot required).
b) In your own words, explain why the Japanese candlestick chart is the most widely used in the financial market.
c) Describe a bullish and bearish candle. Also, explain their anatomy. (Original screenshot required)

a) Explain the Japanese candlestick chart ? (Original screenshot required).
The Japanese candles graphical representations that show the movement of the price in a period of time, this period is known as temporality. The Japanese candlestick chart, unlike the line charts, provide more information regarding the highest and lowest points that the price reached in a period of time, such information is important when taking a trade.
This type of tools that allow us to understand the behavior of prices in the market, was created by Munehisa Homma in 1700, a rice merchant who sought to understand how the markets behaved in relation to supply and demand, this would allow him to know in in the future whether or not it could make any price changes.
b) In your own words, explain why the Japanese candlestick chart is the most widely used in the financial market.
This type of graph is usually the most used in the financial market since they provide detailed and precise information regarding the movements of prices in the market, reflecting values such as: opening and closing price and higher and lower prices, which which is an important aspect when carrying out an operation and having a successful result, these data are more complex to appreciate if we were analyzing a line chart for example.
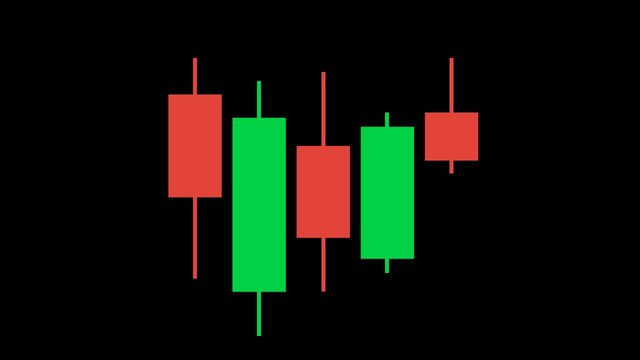
In addition, these charts are quite simple to understand since, in general, in the graphical representations it is very common to identify if a price rose or fell due to the color used in each of the candles: red for the downtrend and green for the trend. bullish, the most expert may not need to see the colors to know about the behavior of the price, but without a doubt this makes it much easier to read.
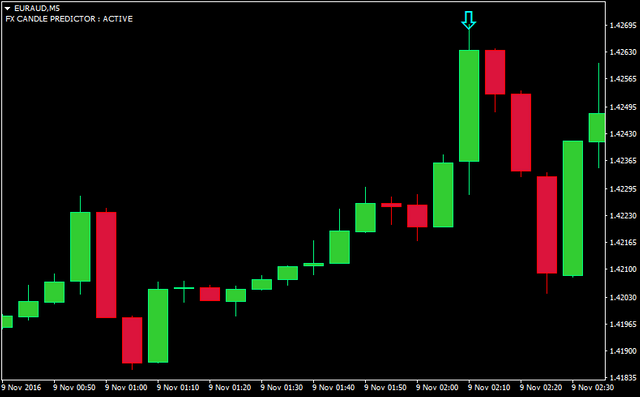
Another reason these charts are widely used is because the pattern or formation of the candles helps predict price action, which helps make better trading decisions.
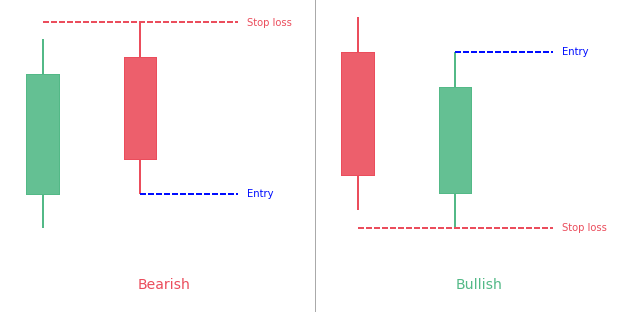
c) Describe a bullish and bearish candle. Also, explain their anatomy. (Original screenshot required)
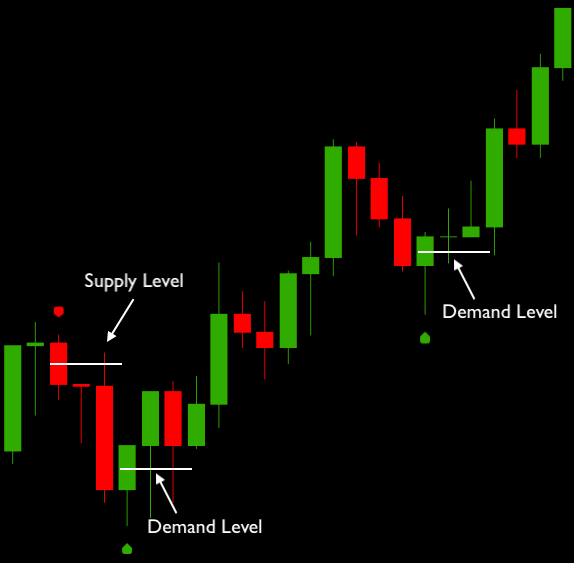
Bullish candles: Bullish candles indicate the consecutive increase in price during a period of time, it is a sign that there is more demand than supply. In other words, this candle movement reflects that the opening price opened lower and closed higher.
Bearish candles: this type of candle reflects when prices are falling, generally a bearish candle opens at a high price and closes at a much lower price, in this type of movement it means that there is more supply than demand in the market.
Anatomy of candles
Bearish candles: The highest part of the body of a bearish candle is the opening price. The lowest part of the body (rectangle) of a bearish candle is known as the close. The highest part of the upper wick (top point) is known as the maximum price, and the lowest part of the lower wick, that is, the bottom point is the minimum point or price that reflects the candle.
Doji candles: as long as the candle has no body, the opening point or price will be the same as the closing price. The highest part of the upper wick (top point) is known as the maximum price, and the lowest part of the lower wick, that is, the bottom point is the minimum point or price that reflects the candle.
The candles provide us with data in relation to prices:
Opening price: It is the price with which the candle starts or opens in a period of time.
Closing price: It is the price with which the candle ends or closes in a given period.
Maximum price: It is the highest price that a candle reaches in a period of time.
Minimum price: It is the lowest price that a candle reaches in a period of time.
Bullish candle: the lowest part of the body of a bullish candle is the opening point, the highest part of the body of the candle is the closing point. The highest part of the upper wick (top point) is known as the maximum price, and the lowest part of the lower wick, that is, the bottom point is the point or minimum price that the candle reflects.
In the case of bearish candles, the maximum is at the same level as the opening, and the closing is at the same level as the minimum.
If the candle is neutral (doji) it has no highs or lows because the close is the same as the open.
If the candle is bullish and does not have a tenth in the lower wick that the minimum is at the same level as the opening of the candle, if the candle does not have a wick at the top we say that the maximum is at the same level as the close of the candle.
In the case that the candle has a small body and is considered as a doji but it is bearish, it is read as the bearish candle described above. In case the doji candle has a small bullish body it is read as a bullish candle.