Steemit Crypto Academy Season 4 Beginers' Course -Homework Post For Task 10: Candlestick Patterns.
Greetings crypto enthusiast.
I really appreciate professor @reminiscence01 for this class. An impact was made.

designed on canva.
1a) Explain the Japanese candlestick chart? (Original screenshot required).
b) In your own words, explain why the Japanese Candlestick chart is the most used in the financial market.
c) Describe a bullish and a bearish candle. Also, explain its anatomy. (Original screenshot required)
1a) Explain the Japanese candlestick chart? (Original screenshot required).
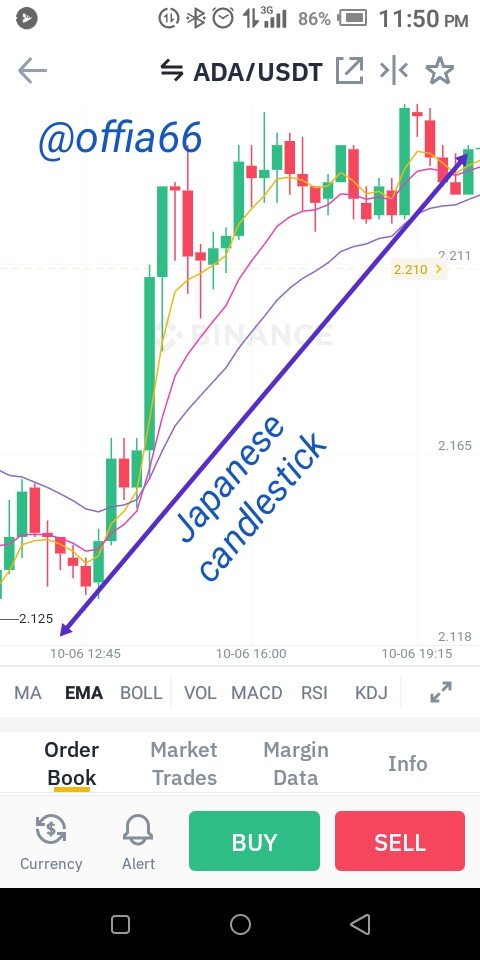
a screenshot of ADA/USDT from binance wallet.
The Japanese candlestick simply refers to a graphical representation of the price of an asset in the market.
The Japanese candlestick chart plays a vital role during technical analysis, it helps to display the price movement (trend) of a particular commodity in the market. It shows all about the demands, supply and distribution of a commodity/asset. The Japanese candlestick chart is used to detect the price movement of an asset in the financial market.
Traders use the Japanese candlestick to detect how the price of a particular commodity tends to either rise (Uptrend) or fall (downtrend).
The Japanese candlestick evolved in Japan in the 1700s and was introduced by Munehisa Homma who was a rice trader.
For the sake of how traders put this Japanese candlestick into use, to detect price movement, it is now famous and used by a lot of exchange wallet today for technical analysis. The Japanese candlestick plays a vital role in the crypto market today.
b) In your own words, explain why the Japanese Candlestick chart is the most used in the financial market.
The Japanese candlestick is frequently used in the financial market for the following reasons:
- The Japanese candlestick is more detailed compared to other type charts.
- It is accurate and easy to understand.
- It helps buyers and sellers to know which trading strategy to apply.
- A good knowledge of the Japanese candlestick helps to reduce losses and maximizes profit.
- Determining the Direction of the market: When using a Japanese candlestick chart it is very easy to determine the direction of the market. The colors and shapes of the candlestick makes it easier to determine market direction for a particular period of time.
c) Describe a bullish and a bearish candle. Also, explain its anatomy. (Original screenshot required)
There are two major type of candlestick which are always displayed on every chart which determines if an asset is experiencing an uptrend movement or a downtrend movement.
- Bullish Candle:
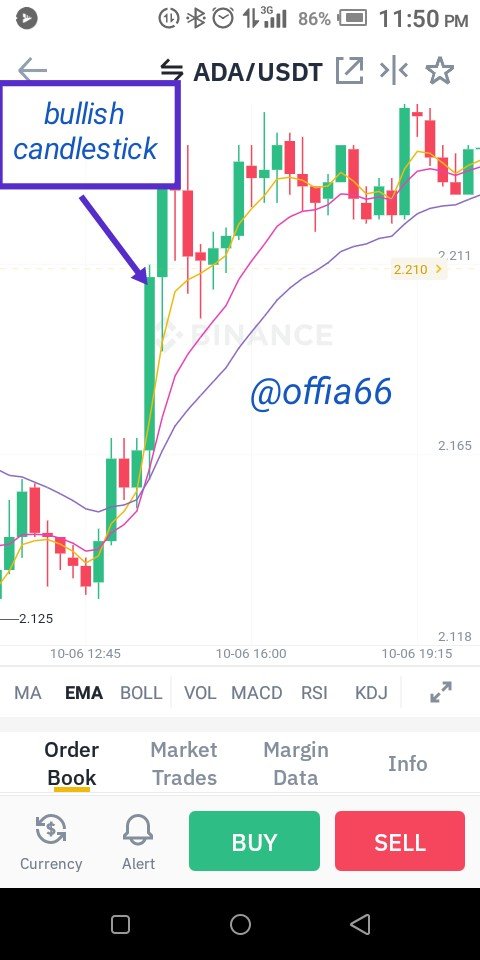
a screenshot of ADA/USDT from binance wallet.
A candle is said to be bullish when the closing price of an asset is higher than the opening price at a particular period of time. A bullish candle brings about an uptrend. A green color indicates a bullish candle.
- Bearish candle:
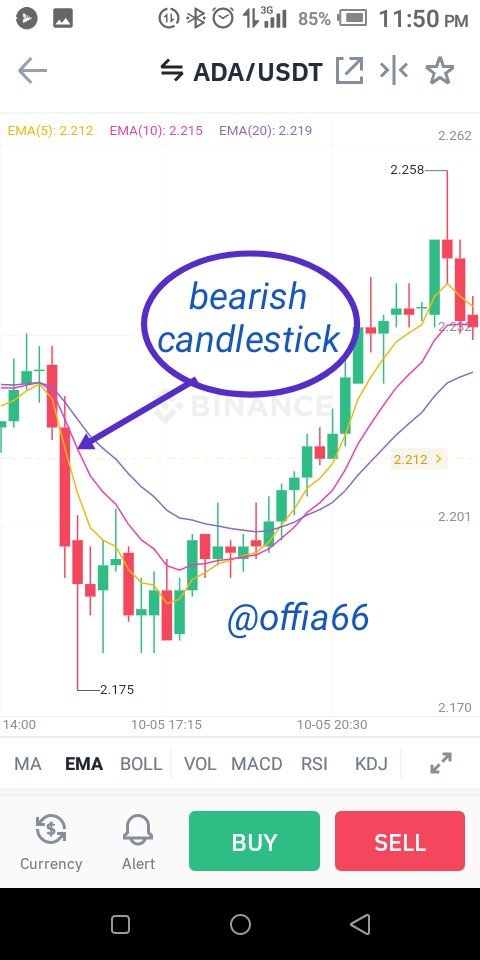
a screenshot of ADA/USDT from binance wallet.
A candle is said to be bearish when the opening price is more/higher than the closing price at a particular period of time. A bearish candle brings about a downtrend. A red color indicates a bearish candle.
Candle Anatomy.
Anatomy of a bullish candle
The Japanese candlestick is used to show the relationship that exists between buyers and sellers, It shows if it is the bears or bulls that are in charge of the market.
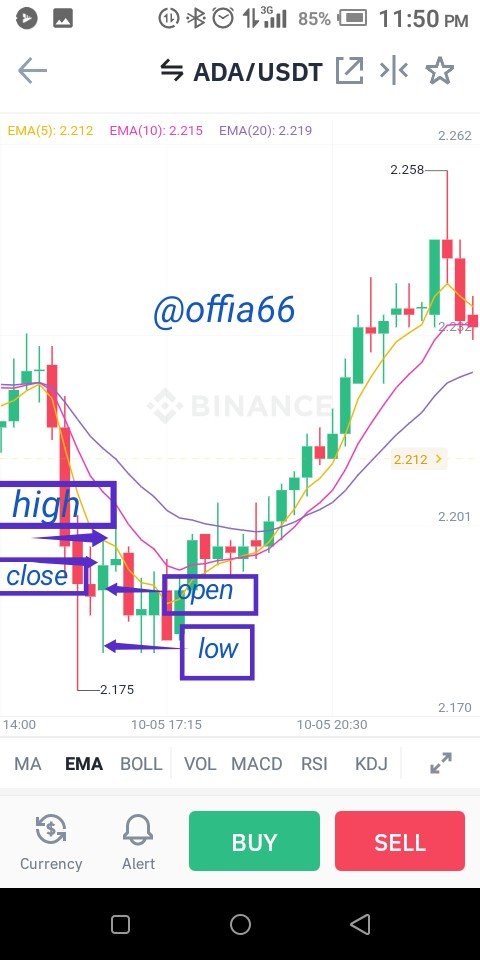
The Japanese candlestick has four (4) major parts. Which includes the following:
- The open, the high, the low, the close.
It has the acronym (OHLC).
- Open: This shows the initial price of an asset/commodity. It marks the beginning of the candle within a specific period of time.
- High (Highest price): This shows the maximum price within a specific period of time.
- Low: This section of the candlestick shows the minimum price within a specifie time.
- Close (closing price): This section of the candle shows the closing price of an asset. It marks the end of the candle within a specific period of time.
Conclusion.
In every market whenever the rate of demand for an asset is higher than it's supply, the price of the asset tends to rise and a bullish trend is observed. On the other hand when supply is higher than demands, the price tends to drop and a bearish trend is observed.
Cc:
@reminiscence01
@dilchimo