Steemit Crypto Academy Season 3 Week 2 - Beginner's Course- Homework| Introduction to Charts By @offia66 for professor @reminiscence01
Maximum regards Prof and fellow students.
The class really impacted a lot of knowledge and all thanks to Prof @reminiscence01.
Homework Tasks.
Designed on canva and screenshot from binance.
Explain the Japanese Candlestick Chart? (Chart screenshot required)
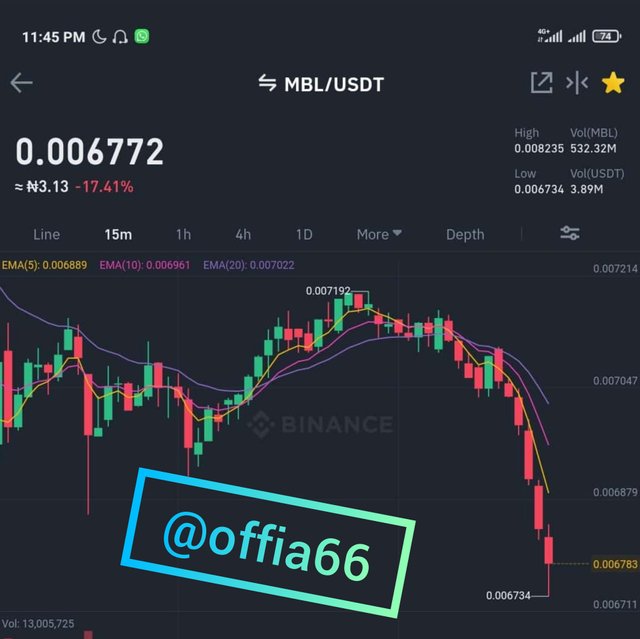
screenshot from binance.
The Japanese candlestick chart I would say it is a tool which is used for technical analysis to identify the price movement (trend) of a particular commodity in the market. It shows all about the demands, supply and distribution of a commodity/asset.
Traders use the Japanese candlestick to detect how the price of a particular commodity tends to either rise (Uptrend) or fall(downtrend).
The Japanese candlestick evolved in Japan in the 1700s and was introduced by Munehisa Homma who was a rice trader.
For the sake of how traders put this Japanese candlestick into use to detect price movement, it is now famous and used by a lot of exchange wallet today for technical analysis. The Japanese candlestick plays a vital role in the buying and selling of cryptocurrency.
The Japanese candlestick has four (4) major parts. Which includes the following:
The open The high The low The close Open: This shows the initial price of an asset/commodity. It marks the beginning of the candle within a specific period of time. High (Highest price): This shows the maximum price within a specific period of time. Low: This section of the candlestick shows the minimum price within a specifie time. Close (closing price): This section of the candle shows the closing price of an asset. It marks the end of the candle within a specific period of time.
It has the acronym (OHLC).Describe any other two types of charts? (Screenshot required)
There are different types of charts but the Japanese candlestick seems to be the most used around the globe.
- Bar chart.
%20(1).jpeg)
Source
Here the price movement (Uptrend and downtrend) of a commodity/assets are represented with bars. Every bar shows the open, high, low, and close (OHLC) of prices within a specific period of time. The bar chat was invented by a Scottish known by the name William Playfair.
- Line chart/ Line graph.
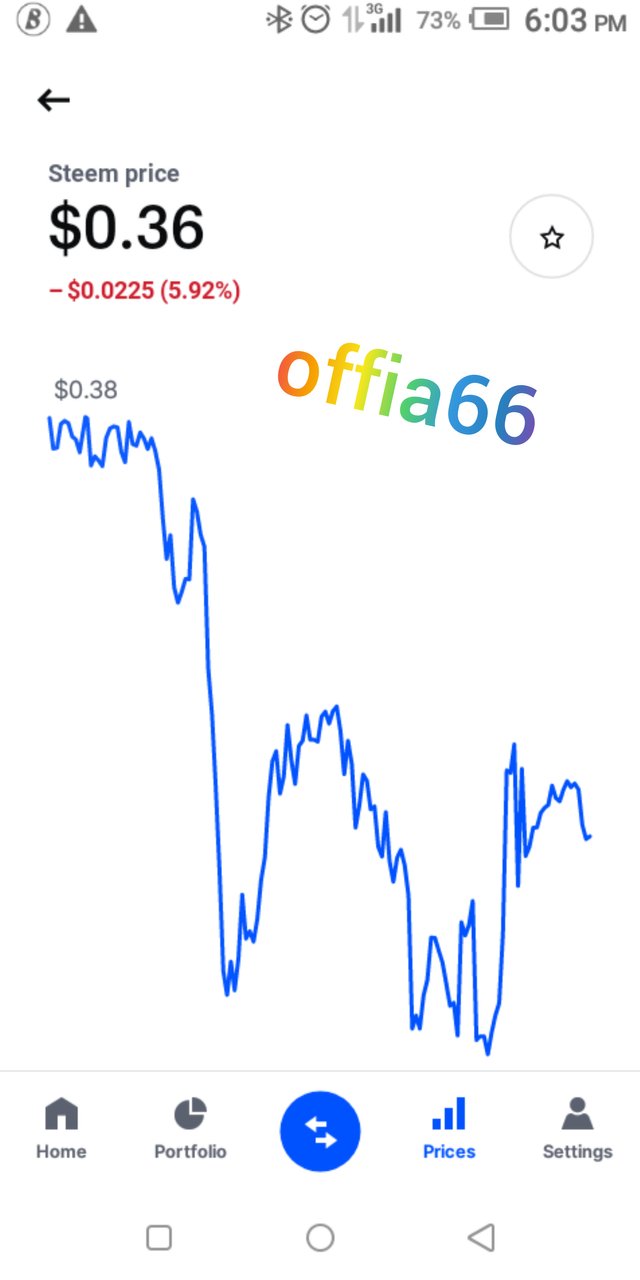
screenshot from Coinbase.
A line graph is used to indicate information that changes within a specific period of time and the information is represented on a line. A line chart is easier to understand and it's advised that traders that are novice use a line chart. A line chart does not carry much information.
In your own words, explain why the Japanese Candlestick chart is mostly used by traders.
Most Traders prefer the Japanese candlestick for a lot of reasons.
Describe a bullish candle and a bearish candle identifying its anatomy? (Screenshot is required).
.jpeg)
Source
A Japanese candlestick actually deals with two colour Which includes:
- Green also known as the bullish candle. This one deals with Uptrend (price increase).
- Red also known as the bearish (decrease in price).
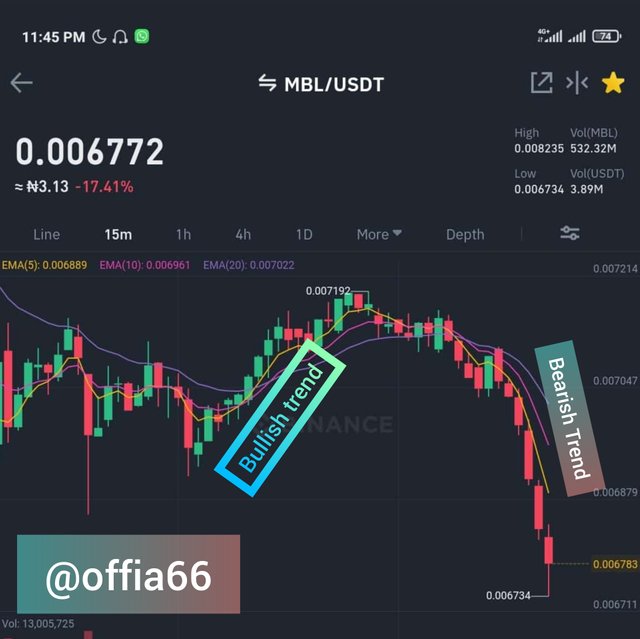
Bullish candle.
Just I stated earlier a bullish candle deals with an increase in price of a commodity. In situations where we have a continuous trend of the bullish candle, it is referred to as bullish trend(Uptrend) and this indicates that over a specific period of time a particular asset experienced a continous increase in price.
Bearish Candle.
This indicates a decline in price. A bearish candle indicates reduction in price and a continuous trend of the bearish candle is referred to as a bearish trend (downtrend).
in conclusion the Japanese candlestick plays a vital role in the crypto market today and is mostly used by exchange wallets. Also a bullish candle deals with an increment in price and a bearish candle is just the opposite of the bullish candle (reduction in price brings about a bearish candle).
Hello @offia66 , I’m glad you participated in the 2nd week of the Beginner’s class at the Steemit Crypto Academy. Your grades in this task are as follows:
Recommendation / Feedback:
You need to spend quality time to submit a good work. Also, learn markdown styles to improve your writing skills. Thank you for submitting your homework task.