Reading Special Bar Combinations - Steemit Crypto Academy / S5W8 - Homework Post for @sachin08
Introduction
Happy new year everyone and welcome to my season 5, week 8 homework post for Professor @sachin08 which he lectured about Reading Special Bar Combinations.
 Image created on canva
Questions
1- Explain Price Bars in your own words. How to add these price bars on Chart with proper screenshots?
2- How to identify trends using Price Bars. Explain for both trend. (Screenshots required)
3- Explain the Bar Combinations for Spending the Day inside for both conditions. (Screenshots required)
4- Explain the Bar Combinations for Getting outside for the Day for both conditions. (Screenshots required)
5- Explain the Bar Combinations for Finding the close at the open for both conditions in each trend. (Screenshots required)
6- Conclusion
1- Explain Price Bars in your own words. How to add these price bars on Chart with proper screenshots?
For a trader to be able to understand the directions of prices in the market for a given timeframe then he should get to know how the price bars operate.
On the LUNA/USDT bar chart as seen on the image below, there are different forms of bars, some longer than the other and every bar indicates the movement of this crypto coin in price over a specified timeframe. It is also important to note that whenever there is a rise in price, the bar is coloured GREEN then that means the Close is higher than the Open or the Open is lower than the Close and if the Open is higher than the Close or the Close is lower than the Open the bar would be coloured RED, signalling a drop in price. 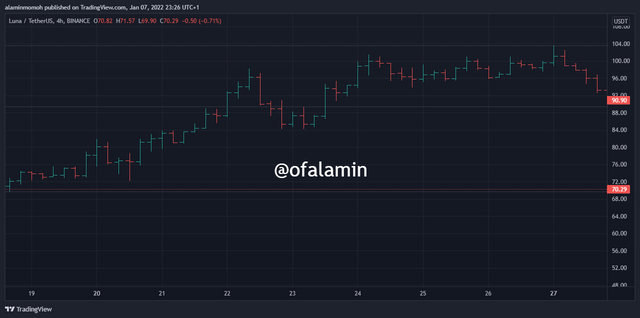 source
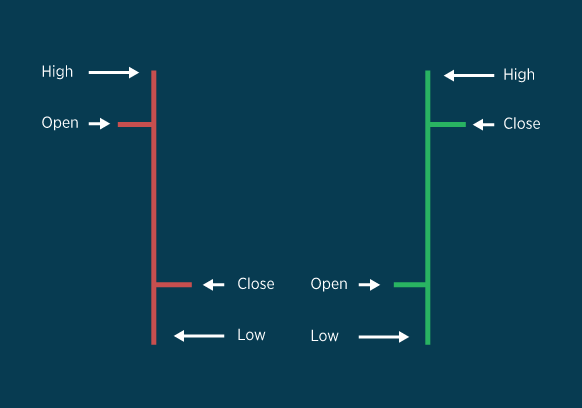
A bar is easily recognizable by its common features or properties which are the;
- Open (horizontal line on the right) price,
- Close (horizontal line on the left) price,
- High ( vertical line at the top) price,
- Low (vertical line at the bottom).
The image below confirms that;
 source
 Traders make good use of a bar chart to observe and gain a good knowledge of the market's trend and price direction. Bar charts enable a trader to make secure trading decisions with no or little risk of losing his assets. Knowing when to make a trade entry, setting the stop-loss and take-profit positions is another importance of the bar chart to a crypto trader.
When a trader chooses to work with a Day-chart timeframe then he is working which the type of chart that forms one bar every 24 hours. This principle also works with other timeframes, a 30 minutes chart produces a new bar every half an hour and so on. Long term traders do not work with days and minutes timeframes, they opt-in for weeks, months or year timeframes.
==>> ADDING THESE PRICE BARS TO YOUR CHART:
- Step One: Click on candlesticks as shown on the screenshot below;
.png) source
source
- Step Two: On the drop-down menu, select and click on bars;
.png) source
source
- Now you have a bar chart to work with.
.png) source
source
2- How to identify trends using Price Bars. Explain for both trend. (Screenshots required)
Being able to identify a trend is part of the major reasons why traders adopt the use of bar charts when monitoring the market and when they want to make trading decisions.
In accordance with the instructions of this question, I am going to discuss how to identify both an uptrend and a downtrend of any crypto pair using price bars;
For an Uptrend:
 source
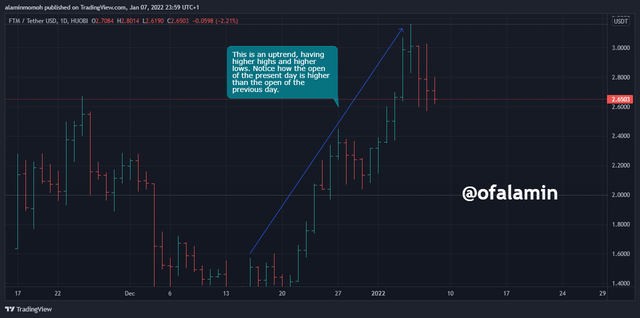
An uptrend in a price bar setting has to do with various bars having more higher highs, green colour in a trend more than fewer bars that are having lower highs with the red colour indicated. On an uptrend chart, you will notice how the lows of the previous day are below the lows of the present day.
An uptrend is created in a market when about a series of bars with a close of today above the close of yesterday in a chart, and it consists of opens of today that are higher than opens of yesterday.
For a Downtrend:
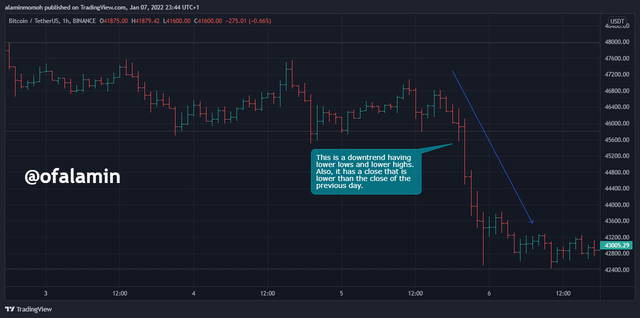 source
A downtrend is quite opposite of an uptrend, this is where a trader can decide to place a sell order after considering all necessary factors.
In this type of trend, price bars consists more of lows of a previous day above lows of the present day, and highs of the previous day above highs of the present day.
In relation to the highs and lows of a downtrend, now you can notice on these bars that the close of the present day is below the close of the previous day, and this is similar to the open. The open of the previous day is above in price of the open of the present day.
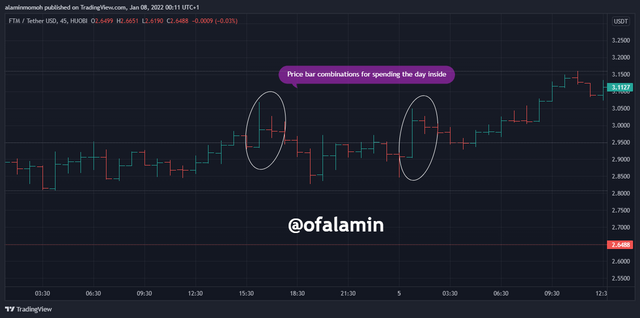
3- Explain the Bar Combinations for Spending the Day inside for both conditions. (Screenshots required)
The ability to spot various combinations in the market when using price bars is what makes a good trader. There are moments when the trend tends to be confused and uncertain, and if the trader is able to notice this, he will wait for the market to take its course again before entering any trade.
In price bar combinations, spending the day inside has two known features. If it doesn't have these features then it is not qualified to be called an inside day;
- When the high of yesterday is above in price of the high of today.
- When the low of yesterday is below in price of the low of today.
What this means is uncertainty, when every buyer and seller in the market is reluctant to make a move in the market. When this happens, it is not easy to tell which direction the price is going to move to next. An inside day can either continue or reverse a trend.
What a trader needs to do in this situation, is wait it out and see how the market is going to play out before re-strategizing, gathering ideas then taking a position in the market.
The features are similar for uptrend and downtrend conditions as show in the screenshot below;
 source
4- Explain the Bar Combinations for Getting outside for the Day for both conditions. (Screenshots required)
In this type of bar combination, when there is a continuation in a bearish run in the market or bullish trend reversal then we can say that the outside day has formed a lower low. Then when the price continues with its bullish run and reverses a bearish run then the outside day consists of a higher high.
For an uptrend:
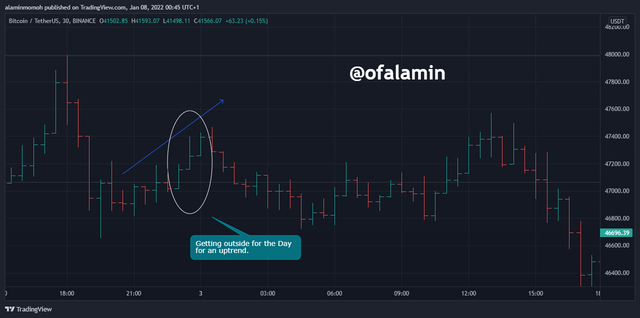 source
In this situation, the open of a price bar has a low price and its close has a price that is higher than the open.
For a downtrend:
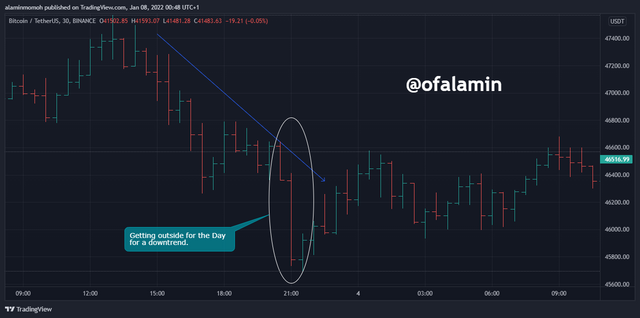 source
Whereas in this situation, the open of the bar is formed at a high price while the close sits below at a low price in the trend.
5- Explain the Bar Combinations for Finding the close at the open for both conditions in each trend. (Screenshots required)
Finding the open at the close is a unique kind of bar combination. Normally, a bar has its Close and Open on the High and Low or Low and High price ranges, but in this case, the Open and Close are right in each other's nose or they are not even far apart. In this situation, the Open and Close are either together at the high line of the bar or together at the low line of the bar.
In every condition, should it be an uptrend or a downtrend, it always has a means of identification or recognition;
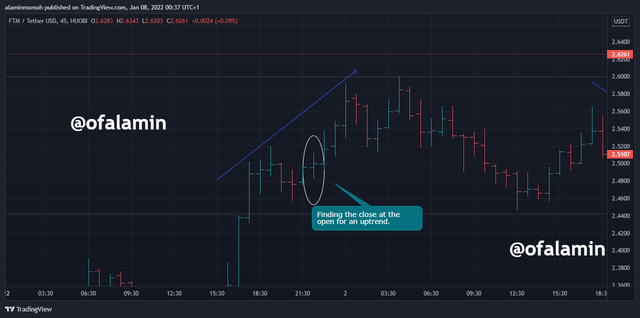
For an Uptrend:
 source
A price of an asset will remain on a bullish run when the Open and Close are together at the high part of the price bar, meanwhile, that bullish trend might face a reversal if these Close and Open stay on the low part of the vertical line of a price bar.
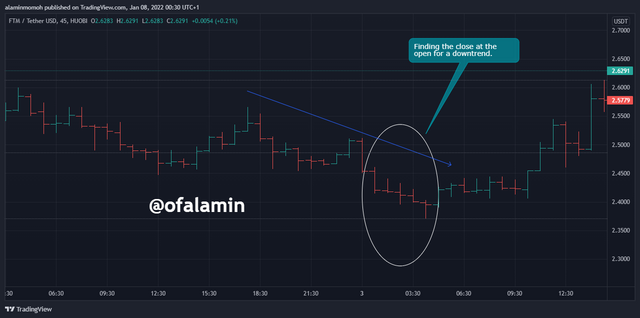
For a Downtrend:
 source
A bearish trend in market price will continue to exist if both Open and Close stay together on the Lowest part of the price bar, and that bearish trend can cease and reverse if these Open and Close form together at the high point of the subsequent price bars.
6- Conclusion
The lecturer has done well in lecturing and explaining all about the price bar and all its various combinations. I understand that price bars can be essential in analyzing the market and looking for signals before taking an entry position inside the market.
Price bars make it easier to foresee the next direction of the market, and how it makes being able to spot an uptrend or a downtrend with their reversal and continuation in a much smoother way.
Thank you for reading through, Enjoy your day.
EVERY SCREENSHOT WAS CAPTURED BY ME.