Steemit Crypto Academy Season 4 Week 2 - Beginner's Course | Technical Indicators. - Crypto Academy / S4W2- Homework Post for @reminiscence01
So without wasting much of your time let me dive in to the business of the day.

In Your Own Words, Explain Technical indicators and Why it is a Good Technical Analysis Tool.
Technical Indicators are used commonly by traders that are active to know historical trading data example of these data include; Volume, open interest and Price instead of revenue, earnings or profit margins.
Technical Indicators are designed in such a way that they analyze price movement in a short time using graph. But this representation of price in a short time does not discourage long term investors and they make use of this indicators to know their entry and exit points.
Technical Indicator is a good analysis tool because;
It helps traders evaluate different investments and analyze statistical trends gathered from different trading activities, these activities include change in Price, Volume etc.
It focuses on price movement patterns, trading signal and many more charting tools for investors/traders and analyst to test the strength or weakness of a security.
It can be used on Stocks, Commodities, Futures,fiat Currencies, Crypto, Fixed Income etc. Since they are security with historical trading data.
Are Technical Indicators Good for Cryptocurrency Analysis? Explain Your Answer.
Yes Technical Indicators are good for Cryptocurrency analysis because they help investors and traders predict the future price of any cryptocurrency of their choice which goes a long way in helping traders and investors take good decisions.
Technical Indicators also help determine the support and resistance levels which shows if the price of any Cryptocurrency has dip (support) or has moved higher (resistance).
It helps traders/investors to also understand the movement patterns of Cryptocurrency Prices in the market which helps them know which trade is liquid and volatile.
Illustrate how to add indicators on the chart and also how to configure them. (Screenshot needed).
I will illustrate how to add indicators on a chart using my trading app called StormGain
- After launching the application, I click on trading and clicked on DOGEUSDT
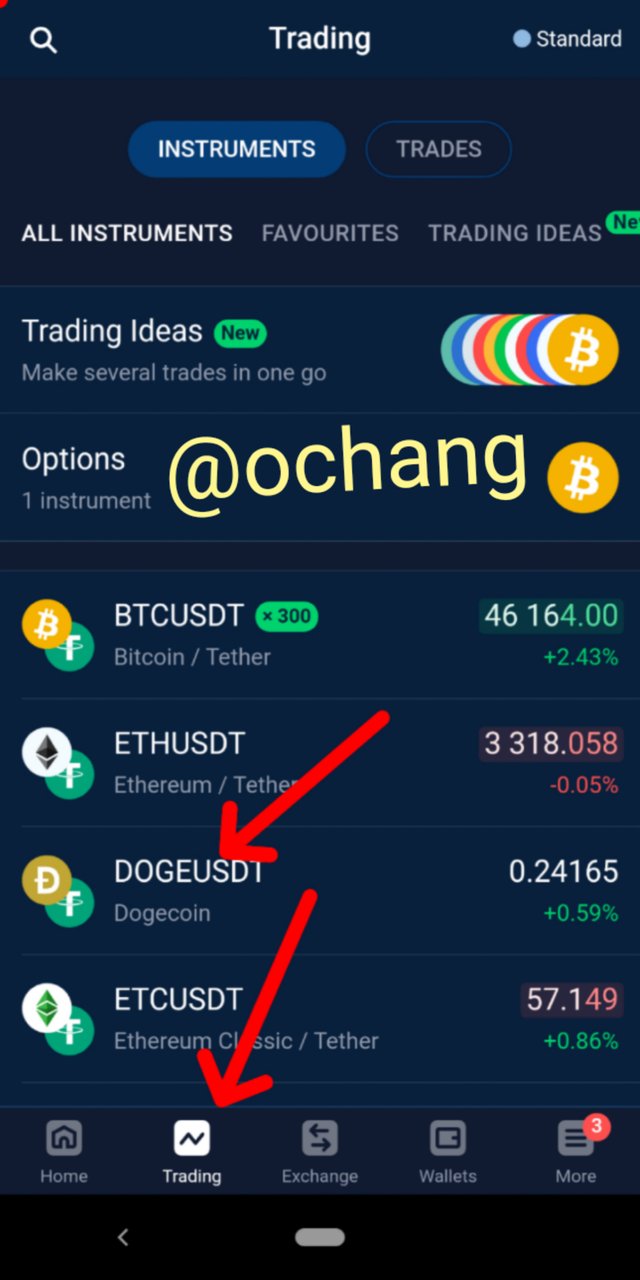
- A chart of DOGEUSDT will then be displayed, I then click on indicators
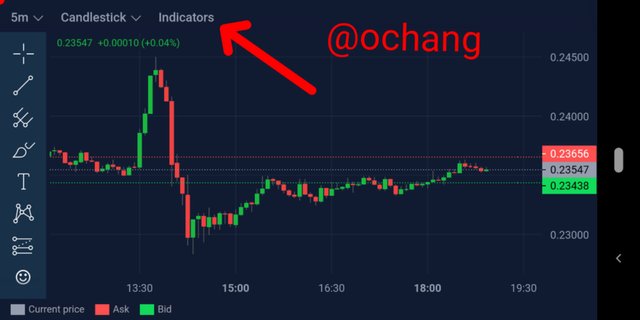
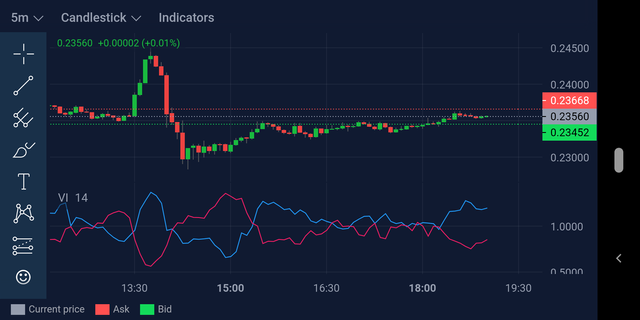
- I then proceed to search for an indicator of my choice, vortex indicator
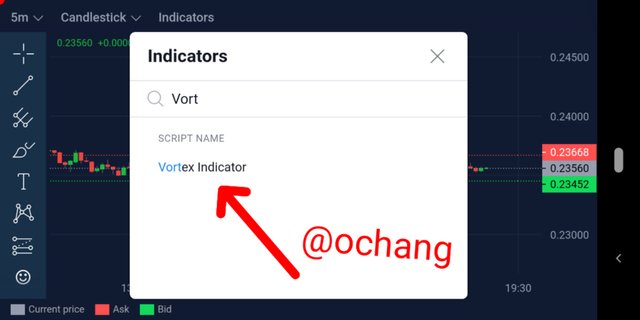
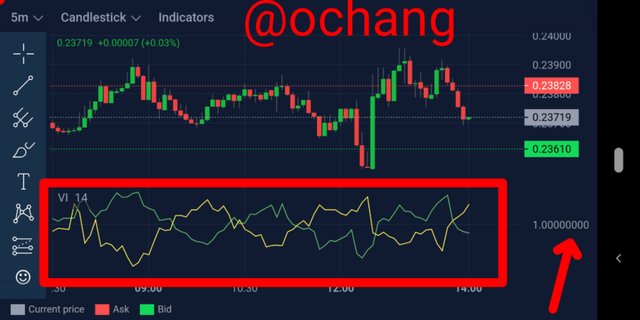
This is how the vortex indicator looks like below
How to Configure a Technical Indicator (Vortex Indicator)

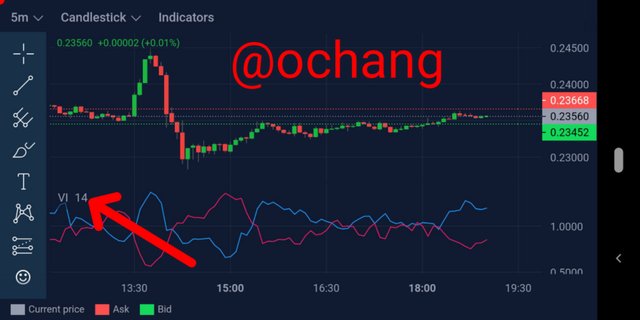
- After I inserted the Vortex Indicator, it came with a menu so the first step is to click on it's menu (VI 14)
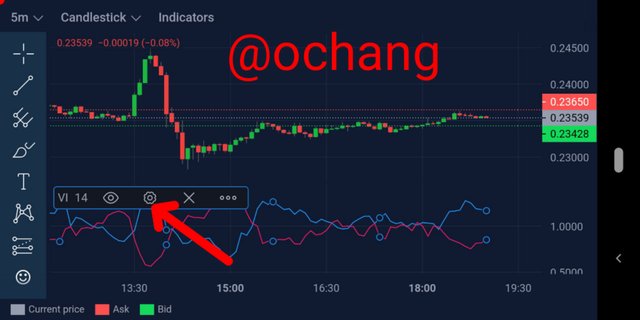
- The next step is clicking on the settings symbol
- When it opened I decided to configure my V+ from blue to green and my V- to yellow and also configure the precision to 8.
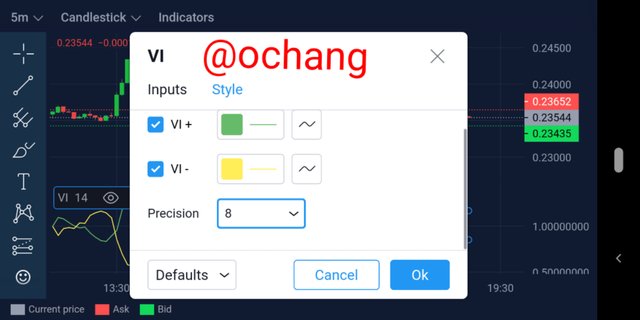
Here is the final result
Explain the different categories of Technical indicators and give an example of each category. Also, show the indicators used as an example on your chart. (Screenshot needed).
VOLATILITY BASED INDICATORS
These Indicators are for measuring upswings or downswings in the market. The upswings made by the volatility of the market can provide good trading option for traders.
So for traders to know the period of high and low volatility of the market they have to make use of the volatility Indicators, which will help them in evaluating this period. Examples of Volatility Based Indicators include; Bollinger Bands, Average True Range (ATR) etc.
Example of Bollinger Bands indicator on the chart.
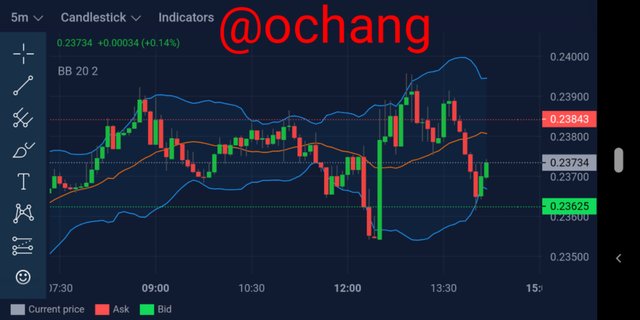
Bollinger Band Indicator : DOGE/USDT Chart
MOMENTUM BASED INDICATORS
These Indicators are used to indicate the movement of price over a period of time and how strong the movements are not regarding whether the price moves up or down.
These Indicators help the traders spot points in which the market can reverse. This points are seeing through divergence between momentum and the price movement. Example of Momentum Based Indicators include; Relative Strength Index (RSI), Moving Average Convergence Divergence (MACD), Stochastic etc
Example of Stochastic indicator on the chart.
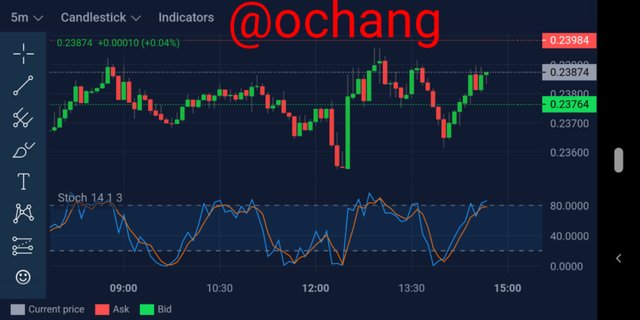
Stochastic Indicator : DOGE/USDT Chart
TREND BASED INDICATORS
These Indicators measure the direction and strength of trends in a particular period of time. They move in an upward and downward direction (wave-like) following the already established trend.
Traders/investors who uses trend trading can enter a long position when the stock/commodity is moving upward. Thus helping the traders make profit through analyzing the momentum of a particular stock in a particular direction. Examples of Trend-based Indicators include; Moving Averages (Simple/Exponential), Average Directional Index ( ADX), Ichimoku Kinko Hyo etc.
Example of Ichimoku Kinko Hyo indicator on the chart.
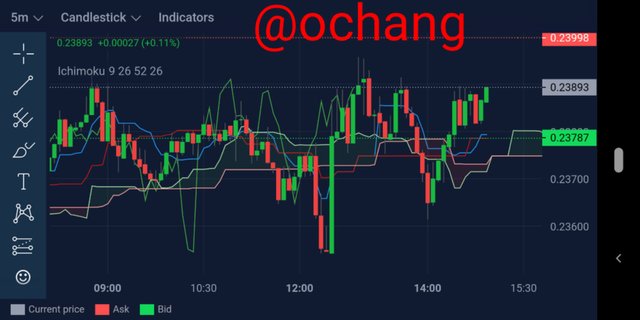
Ichimoku Kinko Hyo Indicator : DOGE/USDT Chart
VOLUME BASED INDICATORS
This Indicators shows the number of stocks bought/sold at a particular time in the market. Volume Indicators give investors/traders early signals of whether the price movement is going to reverse or continue.
Therefore this volume Indicators are very useful to a trader. High volume shows that there is more interest in the stock and there are available traders (buyers/sellers) for the said stock . Example of volume based Indicators include; Volume RSI, On balance volume, Money Flow Index etc
Example of On Balance indicator on the chart.
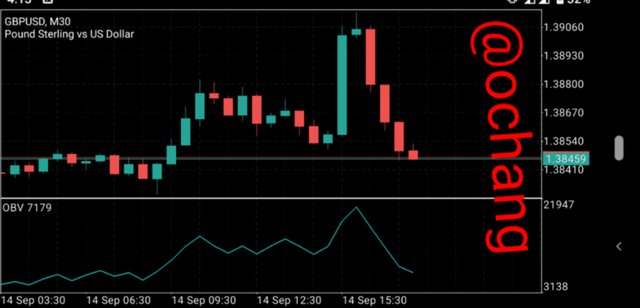
On Balance Indicator : GBP/USD Chart (Screenshot from MetaTrader 5)
Although these Indicators help to understand the market conditions and also help the investor have good trade management, it is still advisable that a trader/investor should that these Indicators do sometimes give false signals and lag behind the current market price.
So for a trader to avoid false signals, he has to use two to three different Indicators to be sure of the signal (if they are all the same), rather than using only one Indicator, because technical indicators work best as a support tool and signal confirmation when they are used with other technical analysis tools.
Explain how an investor can increase the success rate of a technical indicator signal.
For an investor to increase his/her success rate of a technical Indicator signal, he has to;
Avoid standalone tool for technical analysis
Have more than two signals that correspond from price action ( use of multiple Indicators)
And last but not the least;
- For an investor to increase his/her success rate of technical signals, he/she has to select the Indicators that best suits his/her trading style.
CONCLUSION
In this week class I have learnt that technical indicators are one of the technical analysis tool and it is very important in Crypto trading as it assist a trader to understand the movement of the Crypto Prices in the market.
Thanks once again to Prof @reminiscence01 for this wonderful topic.
All Images are screenshots from StormGain application except otherwise stated.
Hello @ochang , I’m glad you participated in the 2nd week Season 4 of the Beginner’s class at the Steemit Crypto Academy. Your grades in this task are as follows:
Observations:
Please relate your writings to cryptocurrency market and not the stock or commodity market. This is Steemit Cryptocurrency Academy.
Recommendation / Feedback:
Thank you for submitting your homework task.