Crypto Academy // Season 3 // Week 5- Homework Post for professor [@lenonmc21] Trade with "Simple and Exponential Moving Averages" + application of the "Fibonacci Retracements" on the chart. @obikay

Theory

SIMPLE MOVING AVERAGE
Simple Moving averages, market indicators depending on price that enables traders to locate the average price of a cryptocurrency within a given period of time. It is also frequently used to access investments and also know trading opportunities by studying the statistics of the preceding market conditions. With this technical analysis, Areas of threat and chances can be recognized.
Simple Moving Average brings out the information from the price and volume of a crypto in relation to its preceding time so as to clarify it's position in the crypto market. The purpose of calculating it, is to level out it's price chart by establishing a continuous update on average price data.
With this, traders can now recognize the trend direction of the given crypo before investing or after.
EXPONENTIAL MOVING AVERAGE
Exponential Moving Average or {EMA} is a new modern of the simple average, it weighs the most current data points when the average of a given day is been calculated.
With it's interest more on the newei data points, the exponential moving average makes sure that the old and unnecessary data points will not have the same impact with that of the newest data points.
How simple moving average is calculated
The simple moving average can be calculated by suming up the prices of the asset and divide with it's periods
The closing price is the known price for this calculation.
For instance.
Take the following as daily closing asset prices: $21, $26, $24, $21, and $22. With this,it's simple moving average for day 1 will be:
($21+$26+$24+$21+$22) / 5 = $96.4
How Exponential moving average is calculated
Since the exponential moving average puts more weight to current or the newest data than the old. It is also referred to as exponentially weighted moving average. It can be calculated with this
Formula:
EMA = (current days Price * k) + (Yesterday's Price * (1 - k )
Where,
k = 2 / ( No. of Days +1)
- it is used to determine a trend of a particular asset. If the slope indicates upwards that signifies an up-trend and if the slope is going down then it is a down-trend
- Support and Resistance
- Another thing with trading with moving averages is that it helps traders to determine the support and resistance lines.
The exponential moving average is quick to react to movement in price because it puts more weight on recent data. With these the exponential moving average is fast to reflect price action and provides more correct results than the simple moving average. Because of thes difference, EMA is chooesn over SMA.
Choosing the one to use depends on the objectives, your personal preference, and trading style. The SMA is also a good choice when it comes down to pointing out support and resistance levels and with the use of SMA one will not get into a fake movement because the SMA reacts slow.
The Fibonacci retracemet, a technical analytic tool which helps to determine the support and resistance shown with lines which is drawn on the price chart of an asset.
Fibonacci sequence is a series of numbers starting with 1 whereby a given number is equal the sum of the two preceding numbers:
1+0=1
1+1=2
1+2=3
2+3=5
3+5=8
5+8=13
8+13=21
13+21=34
21+34=55
34+55=89
55+89=144
The Fabonacci ratio can be derived by dividing the last number by the second one towards the right.
For instance.
1/1
1/2 =0.5
1/3 = 0.333
2/3 = 0.666
3/5 =0.6
3/8= 0.375
5/8 =0.625
5/13= 0.384
8/21 = 0.380
13/34= 0.382
21/55 =0.3
34/89 = 0.617
and so on.
Note: when a number is divided with its preceding value, a ratio of 0.618 or 1.618 will be obtained.
34/55=0.618, this ratio is seen all around in it.
Fibonacci retracements are mapped out to recognize the areas of support and resistance on price chart depending on the numbers from the golden ratio which is converted into percentages. These levels are; 23.6%, 38.2%, 50%, 61.8%, and 78.6%.
Whereby the, 38.2% is gotten from dividing a number in the sequence next to the number found two places towards the right, and 23.6% comes from dividing a number next to the number found three places towards the right.
PRACTICE (WITH OWN IMAGES)
Adding a simple moving average to chart
Step one:
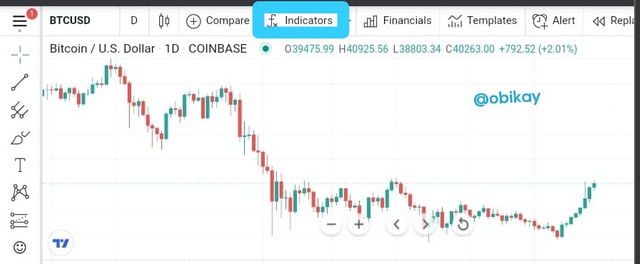
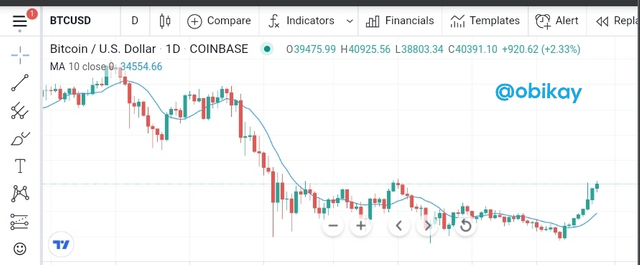
I will be using the trading view platform
https://www.tradingview.com. When you get to the chart interface, you can select your desired crypto and click on the indicator there.
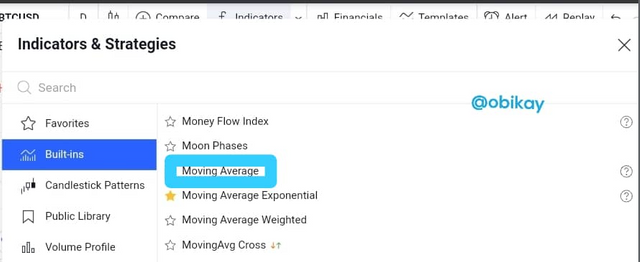
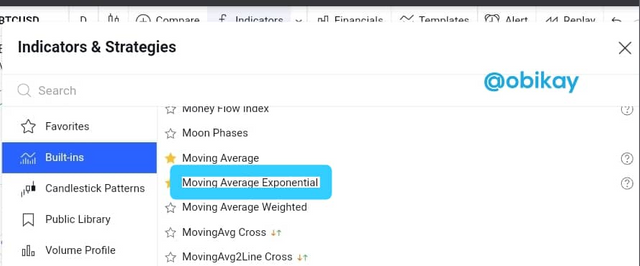
Step two:
The indicator pops up more options, search and select the moving average
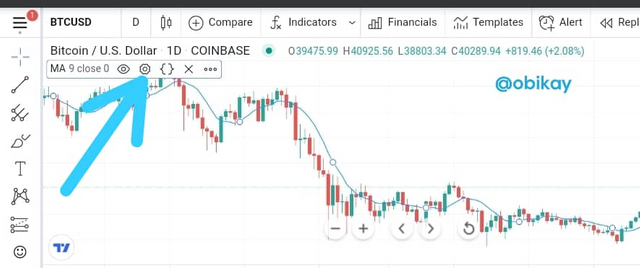
Step three:
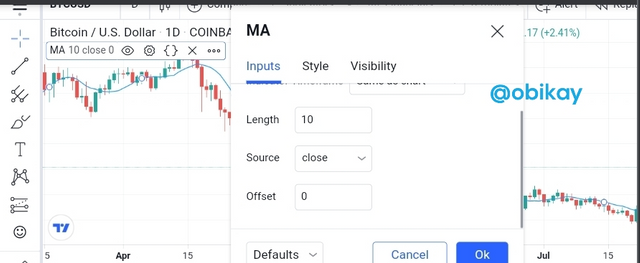
Then we can set our MA by editing from the top left corner of the price chart.
Taking MA = 10
Step four:
Adding exponential moving average to chart
Step one:
Click on the indicator, locate and select the moving average exponential.
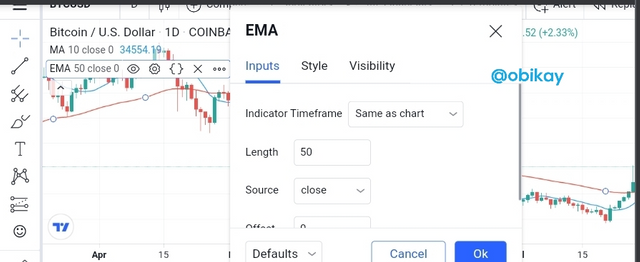
Step two:
Tap and edit the EMA settings
EMA = 50
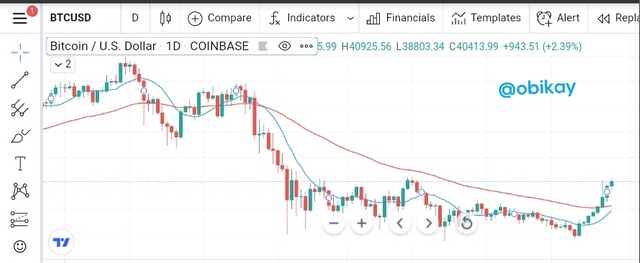
finally the both SMA and EMA have been added to a chart.
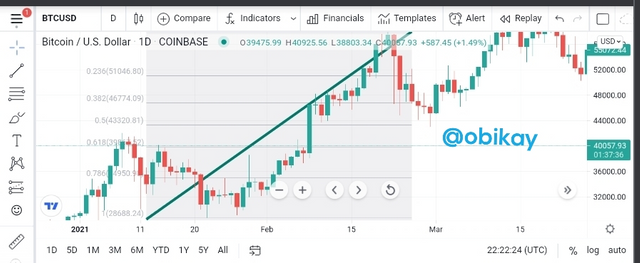
Adding the Fibonacci retracement for the bullish trend. Draw from low to the high.
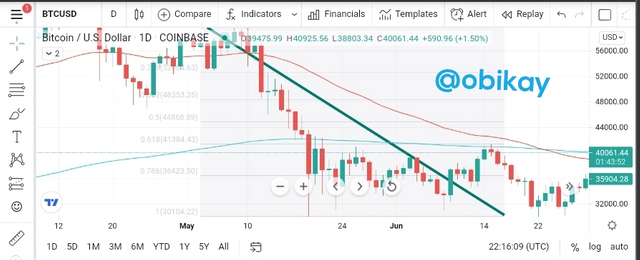
Adding for the bearish, is to do the reverse. Draw from the slope from the high to the low.
Moving Averages are entirely essential part of technical analysis. MA smooths out price action and also help in forecasting of future prices. Can also help a trader to point out the current market trend, hence it follows the price. Therefore, it can be of good use to traders in determining the current momentum of the market.
Thank you professor @lenonmc21 for the lecture