Steemit Crypto Academy Season 3 Week 2- Beginner's Course| Introduction to Charts
Introduction
I am so pleased to be participating in this edition of the Steemit CryptoAcademy.
The lecture was a very nice one.
I will mostly be talking about charts in this session. I hope we all learn something from this article.
1) Explain the Japanese Candlestick Chart? (Chart screenshot required)
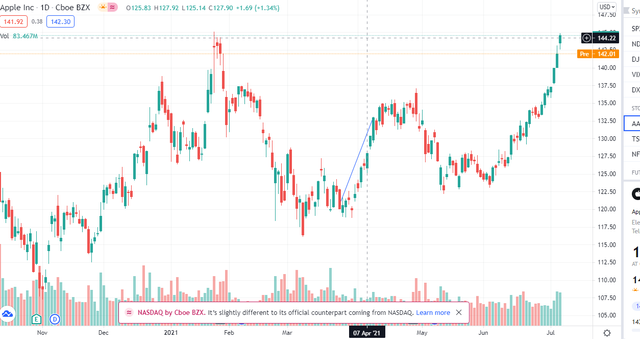
The above is a Japanese candlestick chart.
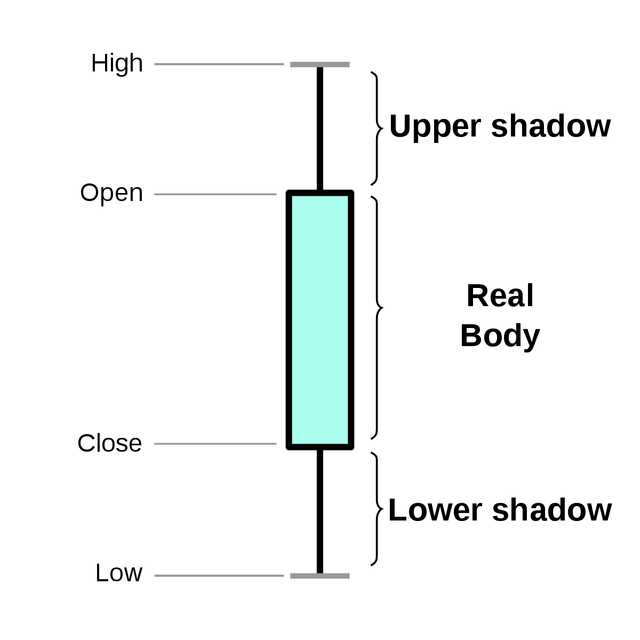
image source
A Japanese candlestick chart is a tool used to detect even the slightest movement in the price of assets.
A Japanese candlestick consists of the following parts: High, Open, Close, Low, Upper shadow, Real Body, and Lower Shadow. I will start by explaining each of the terms listed above starting with High.
High: This shows the highest point the price reached over a particular time frame. Although it is the highest point during a particular time frame, the price can still go down, but never up beyond the "high".
Open: This shows the particular point where the candle's movement started from.
Close: This refers to the last price recorded during a particular time frame irrespective of the high and low. The prices may go up or come down, but the close shows us where exactly the price movement stopped.
Low: This is the reverse of the high, this shows us the lowest price recorded over a particular period. It can go up or down but not below the low.
Upper shadow: This is basically the difference in price between the upper part of the real body and the high point.
Lower shadow: This shows the difference between the "Real Body" and the low point.
Real Body: This is the difference between the "Open" and the "Close" points.
The Japanese candlestick chart has really proved to be a very important tool in the real finance world.
2) Describe any other two types of charts? (screenshot required)
To answer this question, I will talk about "Line Chart" and "Point and Figure Chart.
Let us start with the Line Chart. What exactly is a Line Chart?
A line chart is basically a series of points which when connected from lines which are basically patterns that can be traced. A line chart can make an uptrend or a downtrend.
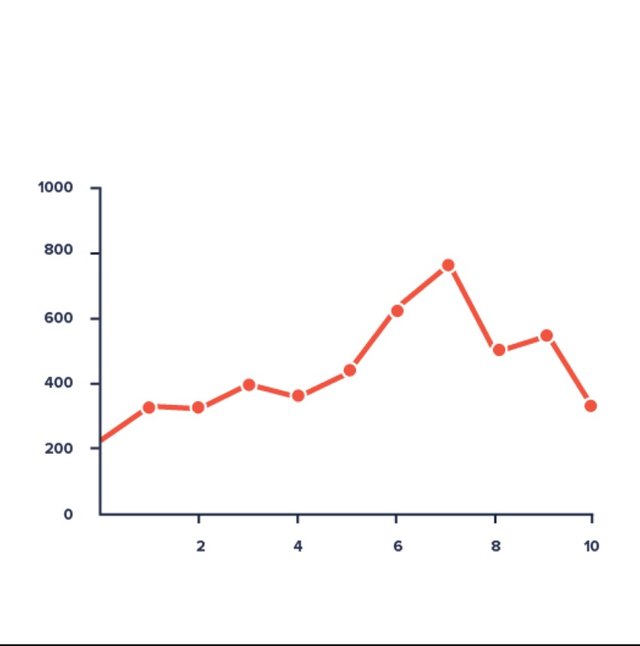
Line charts are used in the stock market, they are used by forex and crypto traders, they are used for tracing patterns and movements of things.
People use Line graphs for so many reasons but just to mention a few, we have: It make collecting and arrangement of data easier, people in the stock exchange make use of them to monitor asset prices, governments use them to monitor population variations, etc.
For the next one, let us take a look at Point and Figure Chart. What is a Point and Figure Chart?
Point and Figure Chart
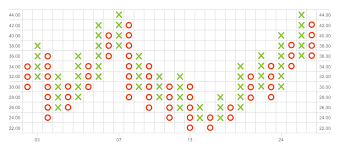
The Point and Figure Chart is basically a chart that makes use of circles and x's for the representation of data and information over a given time frame.
The Circles represent the falling price of assets while, while the x's represent an increase in the price(value) of assets.
There is one important feature possessed by this charting system which is the ability to not show slight changes in the price of assets.
To some people, it is good, while to some it is bad. Let us get it straight, some people believe it is good because it prevents one from simply tampering with assets over little changes in prices which may just last for a few seconds.
Some other people feel it is bad because they believe that no matter how little price movement may be, profits and losses could still be made. To some traders the little changes in price movement are the key moments for them, so they won't tolerate such a chart system.
3) In your own words, explain why the Japanese candlestick chart is mostly used by traders.
Firstly, the main aim of trading is to make a profit. Personally, I believe that most traders prefer the Japanese candlestick chart to others because it is better.
How exactly is it better? The body parts Japanese candlestick chart tells us a lot. From the high down to the low, they all relate and tell us more about price changes than any other chart system out there. The little changes in the prices of assets are all captured by the system. As an individual going into trading, I will pick the Japanese candlestick chart over any other one out there.
4) Describe a bullish candle and a bearish candle identifying its anatomy(screenshot required)
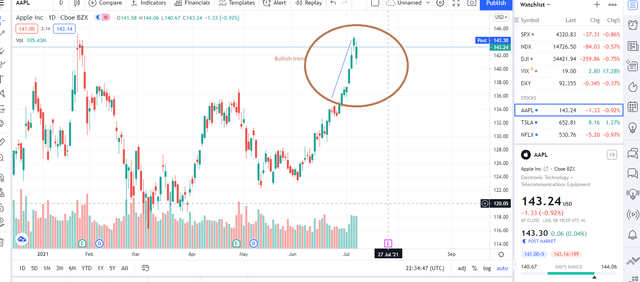
This is a Bullish trend or simply put, an uptrend. It shows that the price of the particular asset is increasing, which means that people are seriously buying at the time.
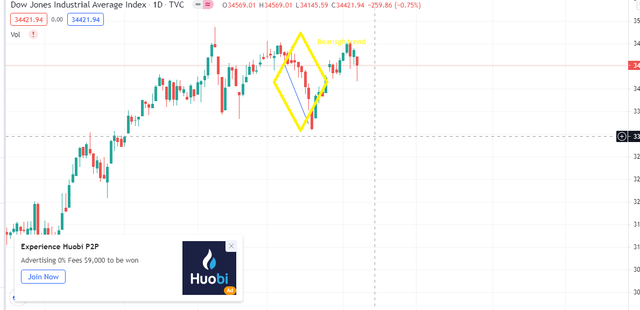
The above is a picture of candlesticks that depict a bearish trend. In this case, the prices of assets are going down so people have to sell. I basically mean that the bears are in control(the sellers).
Conclution
I really hope that I have been able to help some people understand the above topics better.
Hello @nwabueze, I’m glad you participated in the 2nd week of the Beginner’s class at the Steemit Crypto Academy. Your grades in this task are as follows:
Recommendation / Feedback:
Your explanations are too shallow. Please spend quality time to produce a quality content. Thank you for participating in this homework task.
Thanks