Steemit Crypto Academy Season 3 - Dynamic Course For Beginners - Week 3 | All about Trends, Supports and Resistances and simple chart patterns.
It feels so good to be participating in this week's Crypto Academy. I will do my best to add value to the community through my post.
Define in your own words what is "Trend" and trend lines and what is their role in charts?
A trend is generally the direction or pattern that things are following. Trends can be used to describe activities in various contexts ranging from stock prices, population variation, crypto market to clothing and fashion. In this article, we are going to focus on trends as it relates with the crypto market. Let's move on. Let us talk about trend lines.
What are trend lines?
To me, trend lines are simply lines that are drawn with respect to points on a price chart to suggest the movement of prices over a specific period of time. Trend lines can take a rising direction or a falling direction. This tells us that trend lines can form an uptrend or a downtrend.
The role of trend lines in understanding charts generally cannot be over-emphasized. Trend lines are used in charts to connect the pivot positions which helps the trader or analyst to better understand the chart. When trend lines are used, investment decisions can be made with a higher certainty of the price movement.
Personally, I would advise anybody venturing into trading to stick to trend lines.
Let's move on.
Explain how to draw an uptrend line and a downtrend line (show a screenshot of each one)
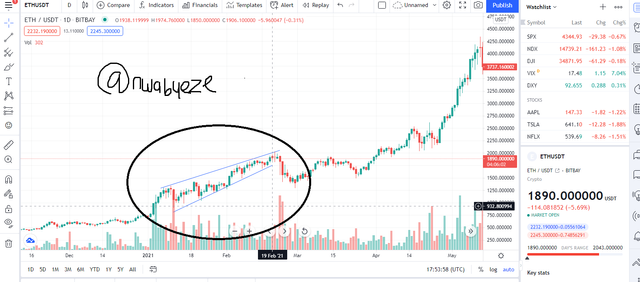
Let us start with uptrend lines. What are uptrend lines? Uptrend lines are lines that indicate an increase in the price of a particular commodity. In the crypto market, it is called a "Bullish trend", which means that the buyers are in control of the market.
As seen in the above image, trend lines are drawn by picking points at the ends of the candle sticks and connecting them. The lines should only connect points from the lowest body parts of the candlesticks. The trend line seen in the image above represents a bullish trend, and it means that the buying pressure is very high.
Let us take a look at the " Downtrend". What is a downtrend?
A downtrend shows a successive decrease in the price of a particular asset. This is the point where the selling pressure is very high; bearish trend. At this point, it means that many people are becoming scared of the market, and the only option they have is to sell and lose their position. This is the point where experienced buyers buy more assets to keep for the future.
How do we draw a downtrend line? A downtrend line can be drawn from the point you notice successive falling in the prices of assets. As it continues a trend can be discovered and studied. In this effect, a downtrend is drawn by connecting the lowest point of a bearish candlestick to another bearish candlestick. It is seen as a connection of bearish candlesticks.
Define in your own words what " Supports and Resistances" are and how we can identify both zones.
In my own understanding, support is a point on a chart where prices can not fall below within a given time frame. Each time prices fall they never fall below that one and they always take their rise from the support.
On the other hand, resistance is a line drawn such that no matter how high the price goes, it never grows beyond the line. Prices may go up or down but they will remain within the resistance line.
Support and resistance lines can be identified very easily. Let us start with support. How do we identify support lines?
Support lines can be identified by studying the chart and pointing out the region where points never fall below in a particular time frame. Draw a line there and that is your support.
Let us move to resistance. How can we identify the resistance?

The above image depicts a resistance image. To find the resistance region, you should trace the points where prices never go beyond when they are rising during a particular time frame. Once the region is identified, a line should be drawn to connect the points from their highest peak.
Explain in your own words at least 2 simple chart patterns with screenshots.
I will talk about the "Double top" pattern.
In the above pattern, prices go up before going down and go up again before finally going below the support line.
The Bulls take control, then the Bears and the Bulls again before the bears finally take control and prices go down below the support.
Ascending triangles: These are triangles that indicate the rise and continuation of a bullish trend. The triangles are drawn by connecting identical points in the bullish direction above and then connecting the bearish direction below. When the trend lines are drawn, images of successive triangles are formed.
Conclusion
I really do hope that we have all learned from this article of mine today.
Trends are a very paramount part of the market analysis. Trendlines help traders to make rational financial decisions and the importance of that alone cannot be over-emphasized.


