Steemit Crypto Academy Contest / S14W2 - Volatility in cryptocurrencies
Cryptocurrency has paved the way for youth to explore multi-money-making strategies in terms of buying and selling assets in the crypto world and profit can only be made if the analysis is made on the market, volatility is also one key area of study that can enhance selling to profit making.
Volatility is a measure of how the price of an asset fluctuates over a given time in the crypto world. In crypto, volatility is measured using a mathematical calculation which is standard deviation, It Predicts the difference between the current price and future price of a given asset. The difference could either come from deviation of the assets or appreciation of the assets. It also predicts the price from the average price. If the volatility rate of an asset is high the asset tends to be very risky to invest in.
Volatility has pros and cons as we all know and its detrimental or beneficial aspects depend on the investor's readiness to take the risk or not. While investing in crypto may bring uncertainty in the mindset of investors due to volatility we should also understand that it could be an opportunity for risk-taking investors to maximize profit. Markets have ups and downs which may temper our minds psychologically but for risk-taking investors, their minds are set to invest.
.jpg)
Let me tell you a brief story that shows how volatility can play with our minds. Recently the Steemit platform has enlightened my knowledge about crypto. So during the introduction of of SBD, I noticed a skyrocketed increase in the price value of SBD when compared to Steems, so I observed and came to the conclusion that since 1 Steem clocked 21 Steem from 18, there might be a possibility for it to increase even higher since I was told that there was a time 1 sbd reached over 40 steems before now. So I decided to sell my steems to get SBD so that if it reached 25 or 30, I sell it back to obtain a higher return on steems, after selling, I noticed after two days the price dropped to 18, that I was so afraid, another thought came into my mind "1sbd may eventually drop back to what it was before which was 15" after few hours of battling with this thoughts I decided to sell it so that I will not be in total loss if it drops to 15, I was afraid so I sold it and after a while 1 SBD skyrocketed to 21steem again. I was more than angry but I couldn't help because I had already sold it.
The Bollinger Bands; This indicator consists of three lines: an upper band, a lower band and a moving average. The moving average is usually set at 20 periods, and the two bands are usually set at two standard deviations from the moving average. If the price moves above the upper band, a period of high volatility is expected and there is the possibility of a market increase. If the price moves below the lower band, there is a possibility of market depreciation and a period of low volatility is expected.
Average True range(ATR); These indicators are used to identify trends in the market, The ATR is also commonly used to set stop losses and take profit levels while staking, trading or analyzing market trends. A high or increasing ATR signifies an uptrend while a reducing one stands for a downtrend.
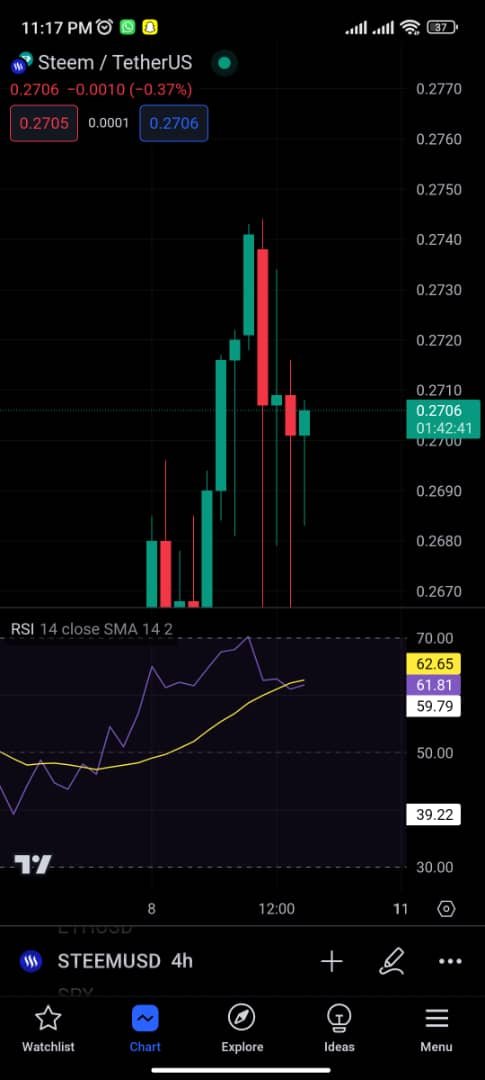
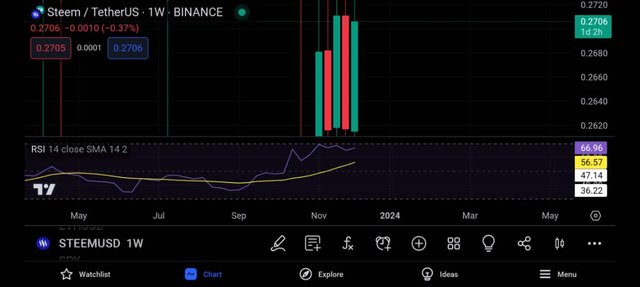
The most commonly used indicator is the RSI which helps to measure the speed and magnitude of price movements. It is often used to identify overbought or oversold conditions which helps traders be able to spot the right time to trade. It has a default setting of 14 periods but it can be adjusted to suit the trader's needs.
- The first step is to open up your trading platform and find the currency pair Steem/USDT.
- Then, look for the indicators menu and click on it.
- Next, find the RSI indicator and select it.
 |  |
|---|
- Once you are done selecting it, you'll need to set the parameters for the indicator.
- The default settings are usually 14 periods, so you can let the default be if you want to.
- Then, click Apply or OK to add the RSI to your chart.
- Apply you can now study the trends values above 70 means that they are overbought while less than 30 show they are oversold with this analysis could be determined.
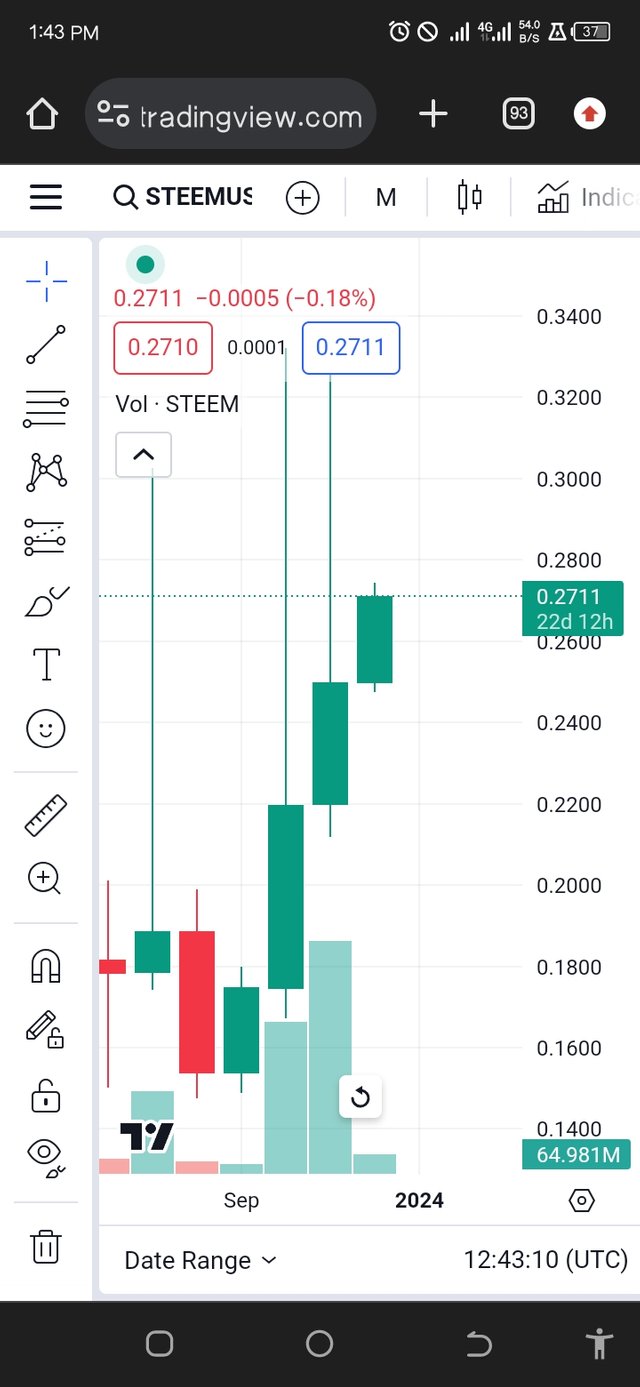
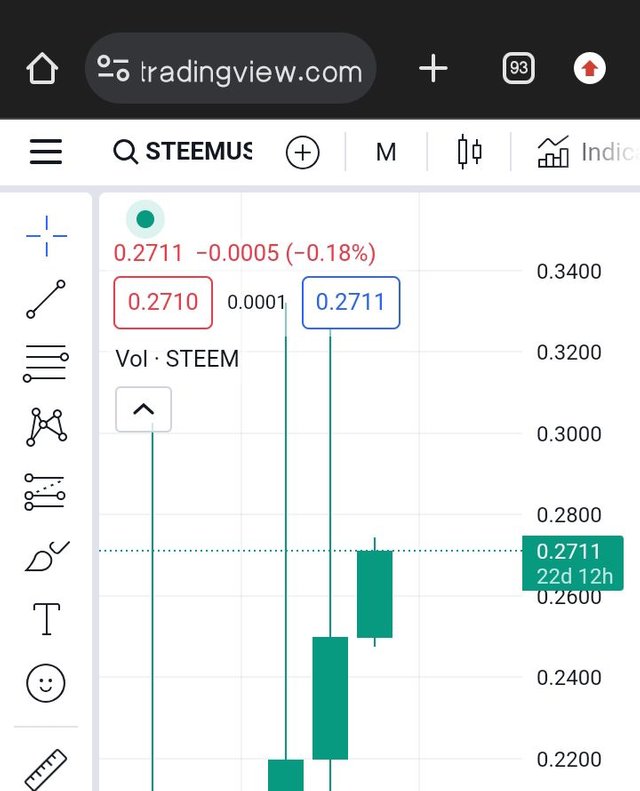 By month By month | 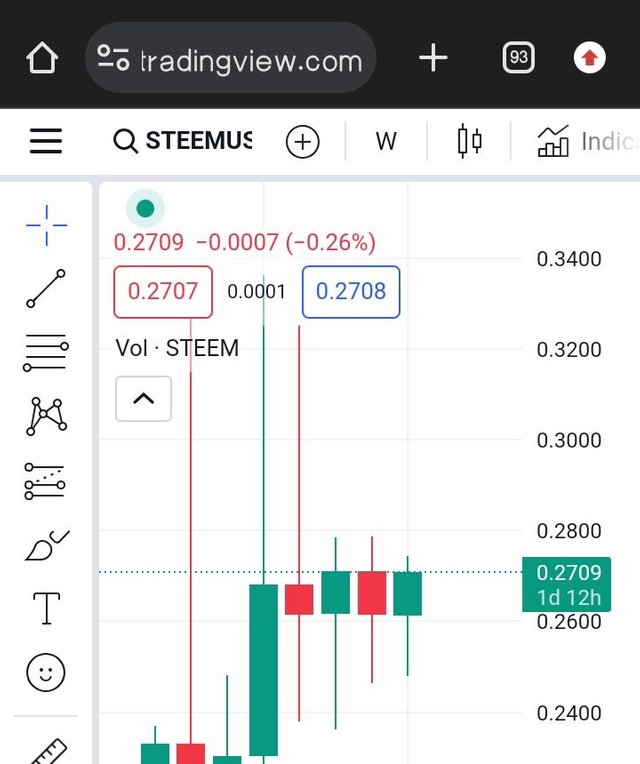 By 4 weeks By 4 weeks |
|---|
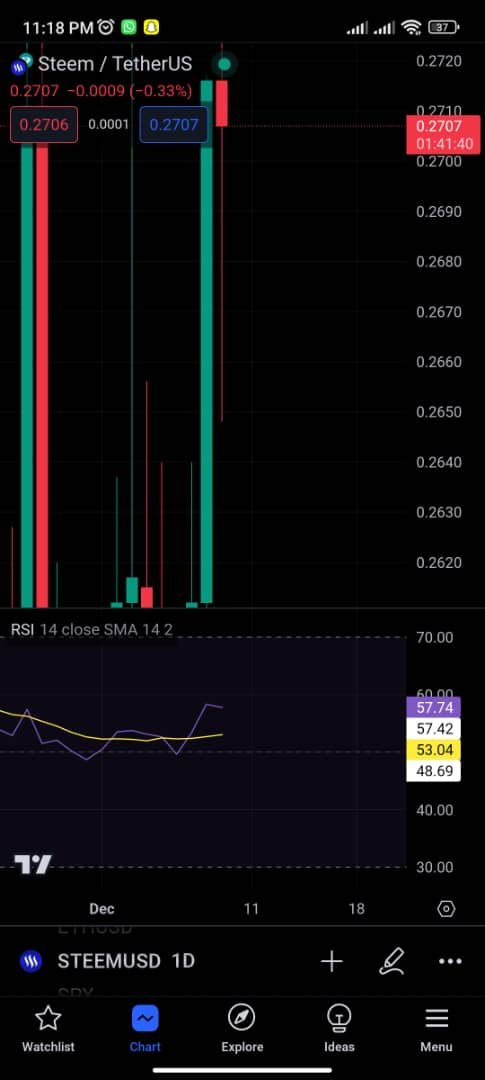
Indicates stability
In November the volatility of the Steem/USDT currency pair was very low compared to that of October and as such the market was in a state of equilibrium which means the relative standard index finds it very difficult to move out of the range of 40 and 60. Something must have influenced the fluctuating price and that could be investors in the market according to popular crypto news.
It is hard to say that the future of crypto is more stable, the fact that the crypto world still exists even without acceptance from many nations, and the government clearly states the unstable pattern it follows. My suggestion is that crypto could be more stable in the future if it receives acceptance from the government. The market still bears fluctuation, ups and downs (volatility) i.e. The market is still a new set of crypto technology that is quite hard to predict. Everything we discover, and the indicators we use all drive us towards stability so I believe the market will be more stable in the future.
I invite @bossj23, @masudo and @dwings to join in this contest

Upvoted. Thank You for sending some of your rewards to @null. It will make Steem stronger.
Twitter link
https://twitter.com/nsijoro/status/1733629016035225643?s=19
Thanks a lot for making sure your participation in this engagement challenge and I am happy to see you here as well as if I talk about volatility then you have explain it in true meanings as well as you have talk about average true range which is an indicator for the measurement of volatility in cryptocurrency is well as you have also explain step by step about it but I would really like to recommend you to add screenshot of an appropriate size that would make your post more beautiful and presentable
If I talk about last question then I really agree with you that we have listened many times that cryptocurrency and it's market is very unpredictable but through using proper indicators we can predict about it so predictions are about its more stability not about its more volatility
I wish good luck to you in this engagement challenge and I pray that may you would become more able to explain in more detail
Hello friend.
It is really good that you have explained about Volatility in your own words and the example you have given about Steem and SBD is really impressive and It has made this concept more easier to understand.
It would be better if you have shown how to add technical indicator which is used to measure volatility like ATR or Bollinger bands because RSI is not an indicator which helps in finding out the volatility of the market.
Have a great day ahead!
Has definido bien la volatilidad como la fluctuación del precio de un activo en un determinado tiempo, aunque debes aclarar que en un corto tiempo. Se mide matemáticamente en base a la desviación estándar de los precios con el promedio del conjunto.
A pesar de ser un mercado de alto riesgo también es el campo de las oportunidades para los inversores más expertos.
Enseñaste a utilizar el indicador RSI, es una herramienta muy parecida al ATR, estableciendo la volatilidad fuera del rango (30-70)%. He aprendido algo nuevo.
En cuanto al futuro estable de las criptomonedas no ves incierto pero piensas que dependerá de la adopción gubernamental.
Saludos y éxitos en tu participación.
hello @nsijoro Your experience with the volatility in the crypto market is a relatable story for many investors. It perfectly captures the psychological challenges that come with navigating price fluctuations. The decision-making process you went through, considering the potential gains and losses, reflects the constant balancing act that crypto investors face.
Your emphasis on the importance of understanding volatility and being prepared for risks is spot on. The crypto market indeed offers opportunities, but it requires a strategic approach and a willingness to adapt to changing circumstances.
Your personal story adds a human touch to the discussion on volatility, making it more relatable for fellow crypto enthusiasts your experience, and I hope your insights resonate with others navigating the dynamic world of cryptocurrencies✨
Greetings friend, I love how you explained volatility in your own words, and the example you shared about Steem and SBD was super impressive. It really helped me grasp the concept better. With time, I see you getting better at this. Good luck friend.
I must say to you friend you really wrote like a professor that you are I really enjoyed your post and all the content it created please I would love you to keep doing such good job
They need of volatility is really more high because it makes the market really unpredictable and profitable to traders who are we experience and knows how to take signal from such opportunity
Thanks for sharing wishing you success please engage on my entry https://steemit.com/hive-108451/@starrchris/steemit-crypto-academy-contest-s14w2-volatility-in-cryptocurrencies
Its a pleasure to read your publication brother the example of Steem USDT which you have shared with us is totally impressive. Yes there are different types of technical indicators which are used to determine the volatility of market such a ATR indicator, Bollinger bands indicator and many more. You are also hoping for the stability of crypto currencies in future by the involvement of government in crypto currencies. Thank you so much for sharing with us.
Best of luck 🤞