Crypto Academy Season 4 Beginner's Course-Task 10: Candle Stick Patterns
1a) Explain The Japanese Candle Stick Chart(Original Screenshot Required)
b) In Your Own Words Explain Why The Japanese Candle Stick Chart Is The Most Used In The Financial Market
c) Describe A Bullish And A Bearish Candle. Also, Explain It's Anatomy (Original Screenshot Required)
It is with great joy that i am composing my task 10 post on the beginner's course, having gone through the homework post and based on my understanding thereof i make my homework task with pleasure for having the opportunity to be here. Let's dive right into it
The Japanese Candle Stick
The japanese candle stick presents a graphical representation of the price of a commodity or asset in the financial market.
The japanese candle stick reflect the impact of the investors emotion on the financial market and this candle stick is often used by technical analyst to determine when to enter or exit a position or trade. This candle stick chart is widely been used by traders
The candle stick charting is based on a technique developed in japan in the 1700's for tracking the price of rice by Munehisa Homma based on how he understands the law of demand and supply, how prices changes and it's effect on the market this lead to the sucessuful formation of this candle stick chart.
The candle stick chart is also used in trading of Crypto derivatives and a powerful trading indicator that helps traders analyze the price movement of an asset maybe in the immediate short term or otherwise. For technical analyst this chart is important to them to ensure that their technical analysis is superb and perfect
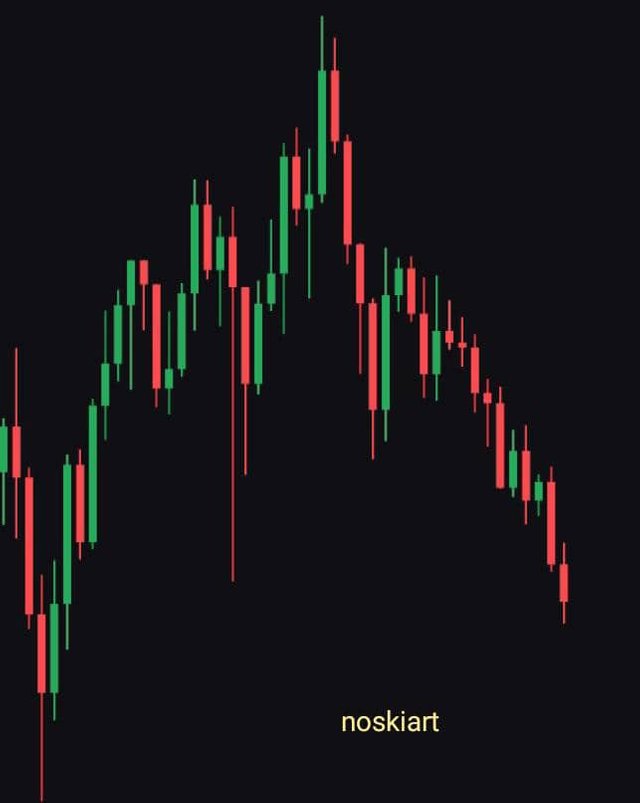
A typical example of japanese candle stick
Why Japanese Candle Stick Is The Most Used In The Financial Market
The candle stick helps us to keep an accurate analysis on supply and demand and how it affects the financial market. The japanese candle stick is a powerful tool that helps technical analyst to accurately predict the trajectory of the crypto market, it can help a trader discern if the market is on a bullish or bearish mode in different time frames as such technical analyst world over turn to candle stick in other to make an accurate detailed analysis on the financial market.
Because of how the candle stick help traders to accurately provide a detailed analysis on the financial market with little margin for error i do believe it is no surprising that it is one of the widely used in the financial market, indeed it is a powerful indicator one that any technical analyst can hardly do without.
A Bullish Candle
We have two major candle stick which denotes the trend a market is in which traders could always take advantage of either to short or long the market depending on the time frames.
We say a candle stick is a bullish one if the closing price of a derivative is higher than the opening price on a particular time frame as the case maybe. It often involve going from a lower trend to a higher one and when we see such candle stick we call it bullish often denoted by a green colour depending on how we set it.
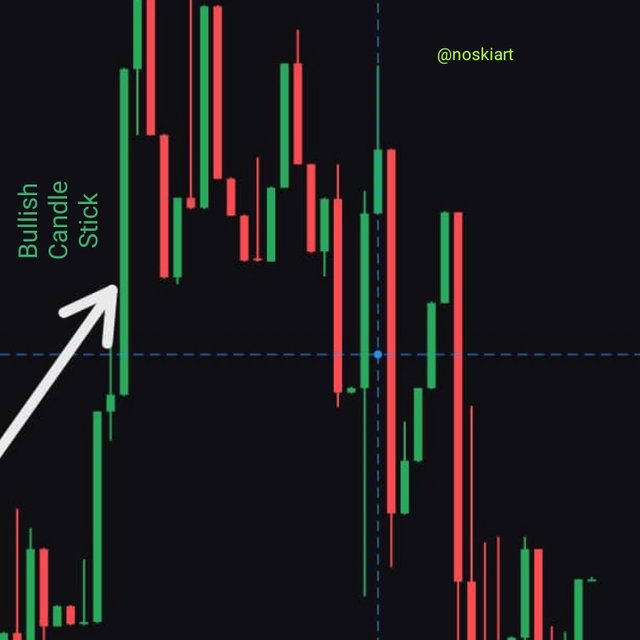 denoting how a bullish candle stick looks like
A Bearish Candle
It's Often denoted by a red candle depending on how we set the color format, it's the opposite of a bullish candle, it's movement of price from an upward trend to a downward one. We say a candle stick is bearish when the opening price is higher than the closing price on a particular time frame.
It's often a bullish price reversal that often leads to a bearish 🐻 candle and vice versa
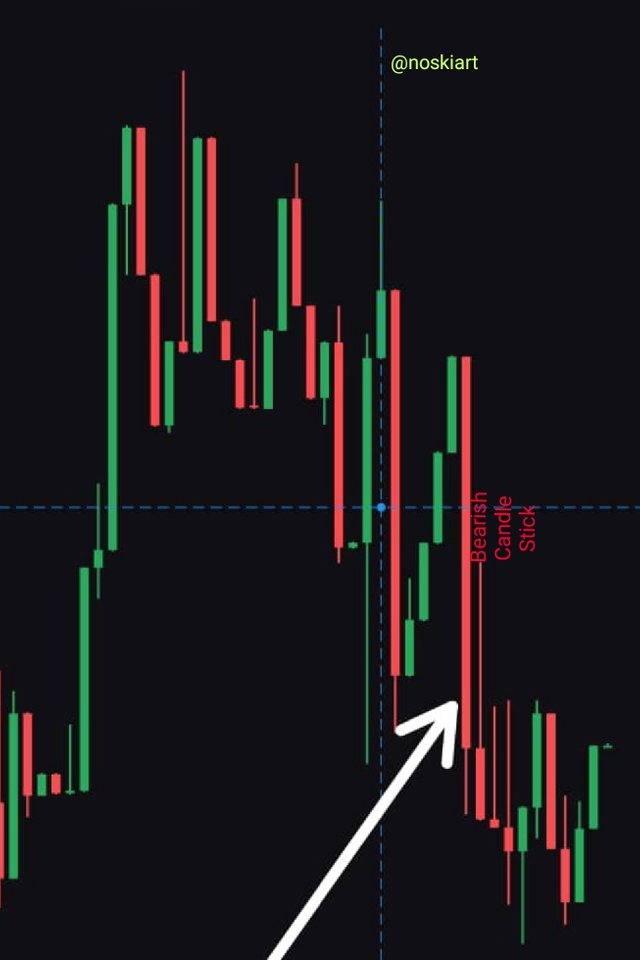 A Bearish Candle Stick
A Bullish And A Bearish Candlestick Anatomy
The candle stick chart basically shows market activities between buyers and sellers, a true reflection of investors emotion on the market. It shows different price point at different intervals and basically the overall trajectory of the marketing general. A candle stick consist of high, close, open and low.
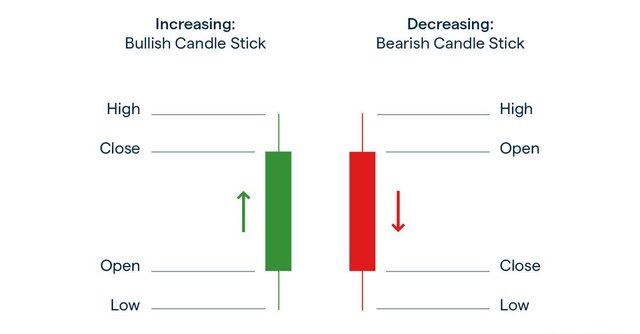
Open: This is the opening price at a particular time frame. It's basically the starting point of a price movement. The price at which a market or a derivative opens in a given time interval as the case maybe.
Low: This is basically the lowest price recorded on a particular time frame on a candle stick
Close: The close as the name implies it's often the closing price on a formed candle stick on a particular time frame as the case may be. Let's say it is the last price point observed on a candle stick.
High: This candle stick shows the highest price that is recorded on the candle stick formed on a particular time frame
Conclusion
The japanese candle stick is indeed a powerful and accurate indicator no wonder it is one of the most widely used by technical analyst in determining price movement and how to leverage this in making profit in the financial market. I for one do love this candle stick chart since it provides information in great details about the trajectory of the financial market and it is indeed highly recommended as long as one is involved in the doings of the market to be a successfully trader or make an accurate analysis which we always ensure one stays on the right side of things and in profit.
N/B: Images used are original screenshot by me and others were properly sourced