What is Confluence Trading and its Importance || Crypto Academy / S5W6- Homework Post for @reminiscence01".
This is a very informative lecture on confluence trading. It is really helpful in trading to confirm the signals and trend
with more than one tool. I try to answer all the questions, I hope it will help you to understand this strategy.

Explain Confluence trading. Explain how a trade setup can be enhanced using confluence trading.
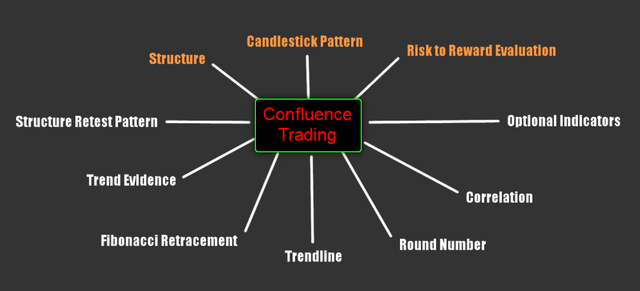
In general, confluence means that one or more things are met at one point for one purpose. If we talk in the context of geography then, the point where one or more rivers meet at one point then the point is known as Confluence. But the trading scenario, the confluence is a trading strategy in which we use multiple trading tools to confirm the signal that is produced by the price actions.
Multiple trading tools are used to confirm the current trend market. If one tool produced the wrong signal then other tools refuse to accept this signal and the trader avoids taking an entry after seeing the wrong signal.
In confluence trading, there are many technical tools involved. In this strategy trading, there are one or more indicator tools and other patterns are included. Traders use patterns and indicators to confirm the trend, breakout, buy, and sell signals then we can enhance the trading setup.
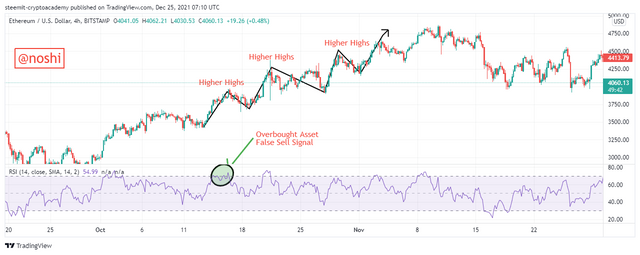
In the above figure, you can see that the market is on an uptrend and if we want to do technically analyses with one technical tool RSI then, you can see that the market making higher highs and RSI show the overbought and sell signal. If a trader sells their asset at this sell signal, then he will be at a loss because the market is on an uptrend.
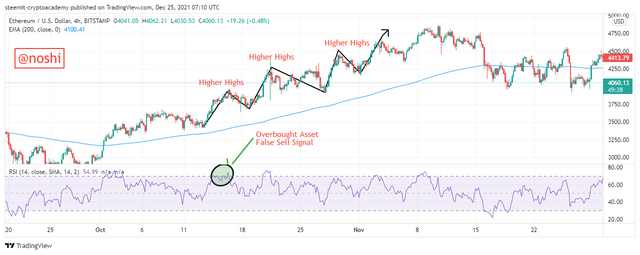
So, to confirm the market trend, I choose the 200 Moving Average indicator at the 4H time frame. When RSI shows the overbought and sells signal, at the same time we notice that the MA is below the price action and did not show any cell signal. In this, we filter the false sell signal of RSI and with 200 MA. If we use more than one technical tool to confirm the signal then, we can make a better trading setup with confluence trading.
Explain the importance of confluence trading in the crypto market?
We can do better trading with the Confluence trading strategy in which we use multiple tools to confirm the signals. In the following figure, you can see that I choose the Wedge pattern. This pattern is made by price in either direction. This price makes higher highs and higher lows in an upward direction.
We draw two trend lines that touch the support and resistance as you can see in the following figure. When price breaks the bottom trend line then it is a sell signal.
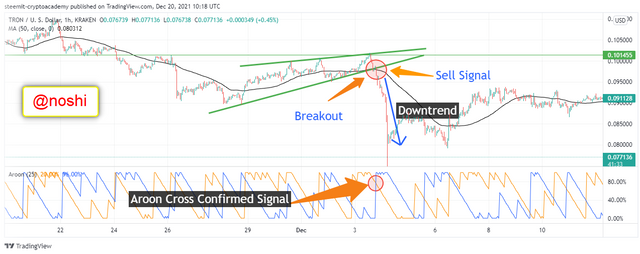
I use another indicator tool 50 MA to confirm the breakout. You can in the figure, when price breakout the bottom trend line, at the same time MA is also cross the price action and place above the price.
Next, I use another indicator tool to confirm both indicator signals. I use the Aroon indicator at 25 lengths. You can notice that, at the breakout, Aroon indicator crossover is happen. It also indicates the sell signal. This way we can confirm the trading signal with the use of more than technical tools.

Importance of Confluence Trading
- It helps us to set a better trading setup by using the confluence trading strategy.
- It helps traders in making decisions.
- Traders filters false signal by using a confluence trading strategy.
- It reduces the risk and increases the reward rate.
- Confluence trading increases the trader's experience.
In this way, we can see that how a confluence trading strategy is important in crypto trading. Traders see the current market situation by using multiple tools from a different angle. Every angle is important and helps the trader to make better decisions after merging all the outputs of all tools.
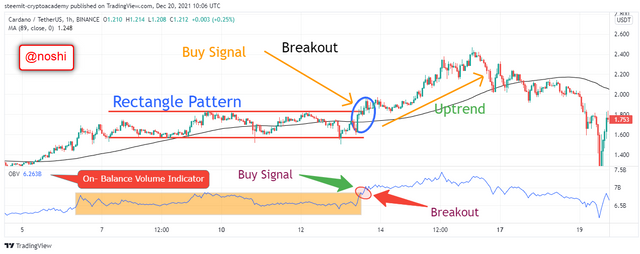
In confluence trading, we can apply different tools for trading setup. In the above questions, I will explain the sell trading setup with wedge pattern, On-Balance-Volume indicator, and Moving Average. Here I will explain another example of buy setup.
In the above figure, you can see that I draw Rectangle Pattern on the chart. I also apply two more indicators to confirm the signal. You can see that breakout signals are produced by both Rectangle partner and On-Balance-Volume indicator. Next, I set the buy trade setup after seeing the signals
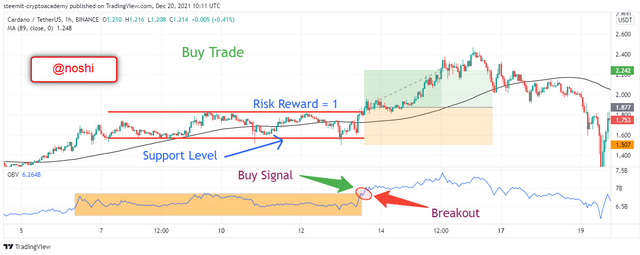
In the above figure, you can see that the breakout signal is confirmed by both MA and Aroon indicators. Both displays cross over and buy signals. In this way, we can use different tools to place a trade. After confirming the signals, I place a buy trade. In this, we can see that how important confluence trading is in crypto trading.
Explain 2-level and 3-level confirmation confluence trading using any crypto chart.
In this, we will discuss the levels of Confluence trading. First, we will discuss the 2 level confluence trading strategy. Secondly, we will 3 levels confluence trading strategy. Both are better at trading but in 3 level confluence strategy, one more tool is added that increases the effectiveness to confirm the signals.
Two-Level Confluence
In this confluence trading strategy, there are two technical trading tools are used to confirm the current market situation. The trader chooses any two technical analyses tool of choice according to his trading style to confirm the signals.
In the following figure, you can see that I choose two trading tools for signal confirmation. One is a wedge pattern and the second is Aroon Indicator at 25 lengths. Market make Wedge pattern. When price breakout the bottom trendline, the market will be on a downtrend.
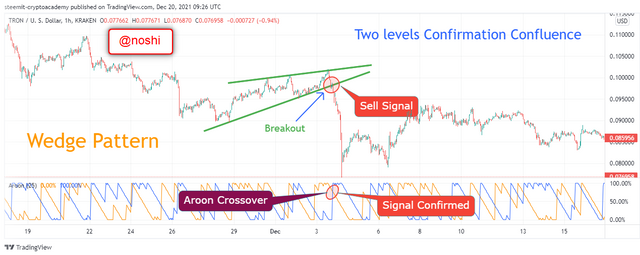
You can see that, when price break the bottom trend line, at the same time Arron Cross show shows that this breakout is real and you can place a sell order. Because after the breakout, the market is on a downtrend. You can see that after the breakout, the market is on a downtrend.
Three-Level Confluence
In this confluence trading strategy, three technical trading tools are used to confirm the current market situation. The trader chooses any three technical analyses tool of choice according to his trading style to confirm the signals.
In the following figure, you can see that I choose three trading tools for signal confirmation. One is wedge pattern and second is Aroon Indicator at 25 lengths and third is 50 Moving Average. Market make Wedge pattern. When price breakout the bottom trendline, the market will be on a downtrend.
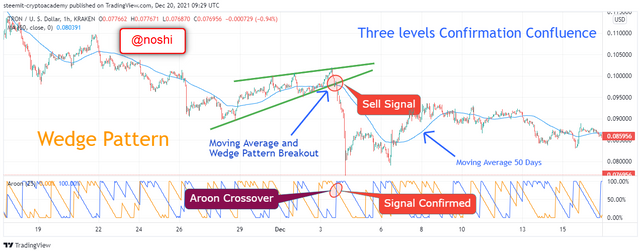
You can see that, when price break the bottom trend line, at the same time Moving Average also crosses the price and above the price action. It indicates the downtrend. To confirm the above two sell signals I chose the Arron indicator.
You can notice that at the time of Breakout the Arron Cross shows that this breakout is real and you can place a sell order. Because after the breakout, the market is on a downtrend. You can see that after the breakout, the market is on a downtrend.
Analyse and open a demo trade on two crypto asset pairs using confluence trading. The following are expected in this question.
In this question, I chose TRX/USDT pair for setting the buy trade. I use confluence trading to confirm the trend and signals. I chose two-three indicators and one trendline to confirm the buy signal. Now we understand the working of every tool.
a) Identify the trend.
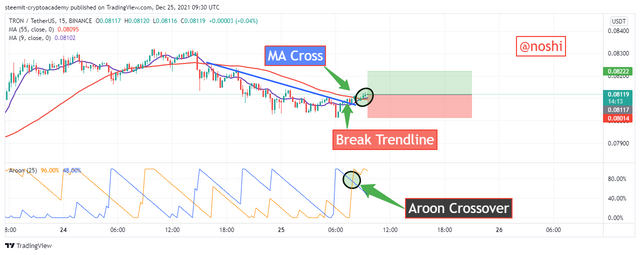
In the figure, you can see that the market is on a little downtrend because I set the chart to 15min. Market make lower low and the price is decreasing. I also mention the downtrend with a blue trendline.
b) Explain the strategies/trading tools for your confluence.
First, I apply two Moving Average at 55 and 9 lengths respectively. These moving averages confirm the trend and trend reversal. Next, I use the Aroon indicator. Aroon indicator is used to determine the buy and sell signals. And next, I use the trend-breaking strategy. When the market breaks the trendline in either direction, then it produces the buy or sells signal.
c) What are the different signals observed on the chart?
In this buy trade, I use three trading tools that produced several trading signals. In the figure, you can see that the first, is produced by Trendline that is broken by price. When price breaks the sequence trendline, it indicates the buy Signal.
To confirm this buy signal I apply the Aroon indicator. In the figure, you can see that the second signal that is produced by Aroon's indication is a confirmation of the first signal. Aroon down and Aroon Up crossover indicates the Buy signal.
To confirm the above two signals, I chose two MA with 55 and 9 lengths. When they cross each other then it indicates the Buy signal. So, after confirmation of all three signals, I place buy trade as you can see in the figure,
Buy Order with Confluence Trading
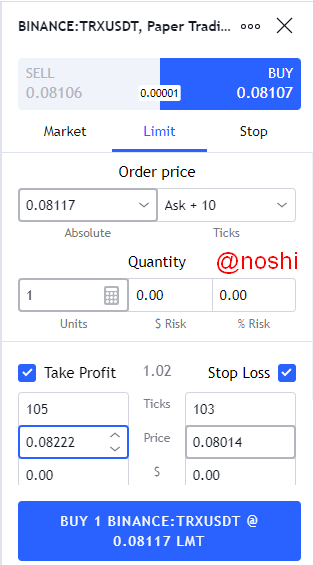
Here are my order details.
Price = $ 0.08117
Stop Loss = $0.08014
Take Profit = $0.08222
Risk/ Reward = 1
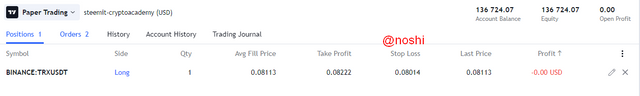
Order is placed using the paper trading platform.
Confluence trading is an effective trading strategy in which we confirm the signal using multiple trading tools. We can do safe trading by using more than one tool in doing technical analyses. We can confirm the current trend by using more than one technical tool.
If one tool produced wrong signals then other tools prove it wrong and traders avoid taking an entry after relying on one tool. In the same way, traders confirm the buy and sell signal by using the confluence trading strategy.
Hello @noshi , I’m glad you participated in the 6th week Season 5 of the Beginner’s class at the Steemit Crypto Academy. Your grades in this task are as follows:
Recommendation / Feedback:
I commend your writing skills. Thank you for participating in this homework task.
Thank You Professor for encouraging response. 😊