Understanding and Detecting Trend and Trend Reversal||Crypto Academy / S5W3- Homework Post for @reminiscence01".

This is a very informative lecture on detecting and understanding the trends and trend reversal in the market. These are the basic things that every trader should understand before starting trading. It is a very good lecture in which the professor describes every aspect of a trend reversal. I have to answer all the questions. I hope it will help you more to understand more about trend reversals.

Explain your Understanding of Trend Reversal. What is the benefit of identifying reversal patterns in the Market?
The market price is fluctuating and making highs and lows. When market price follows a particular pattern and moves in a particular direction continuously then we can say that the market is in trend. The type of trend is depending on the movement of price in a particular direction.
When the market price moves in an upward direction by following a particular pattern then we call it the market is on an uptrend. When the market price moves are a downward direction by following a particular pattern then we call it the market is on a downtrend.
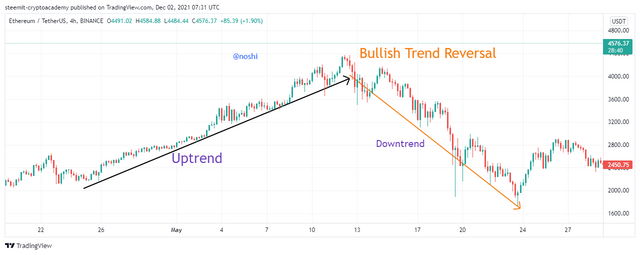
When the market price reaches the highest level, it means that the accumulation process altogether is complete, and next the distribution process is about to start. When price breaks the particular pattern that the market follows to make a trend, it is a sign of trend reversal.
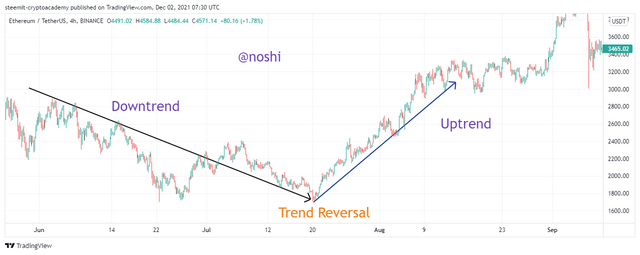
When price breaks the type of trend line the structure of a particular pattern is ruined. After breaking the structure of the trend the market price is up/ down according to the nature of trend reversal. When the market breaks the structure of trend in a downward direction then, it is uptrend reversal and when the market breaks the structure of trend in an upward direction then it downtrend reversal.

What is the benefit of identifying reversal patterns in the Market?
- We can make a good profit by identifying the trend reversal in the market.
- In bearish trend reversal, we pick the fine buying opportunity to gain profit in the future.
- In bullish market trend reversal, we get the best-selling point before getting the price down.
- If our identified reversal pattern goes well then it increases our trading experience.
How can a fake reversal signal be avoided in the market? (Screenshot needed).
Sometimes market price follows the trend reversal pattern and shows the wrong signal of buying and selling. So, these fake signals are great challenges for traders. Because due to fake trend reversals, traders stuck in and made wrong decisions by seeing fake trend reversals.
So, it is necessary to avoid these fake trend reversal signals. There are many technical tools that are used to figure out the fake trend reversals. I will use the indicator named Relative Strength Index (RSI) with 14 lengths. According to the RSI indicator, the trend reversal happens when the price at it is oversold or overbought zone. When Bearish trend reversal then RSI should at oversold zone. And When bullish trend reversal then RSI should be in the overbought zone.
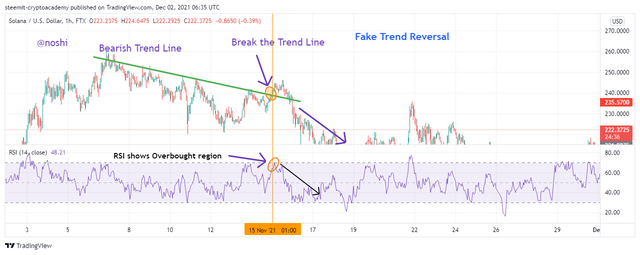
As we can see in the above figure, the market price of SOL is on a downtrend by following the bearish trend line pattern. You can see that when this pattern is broken by the price then the price should go up. But in the next move, the going down so it is a fake reversal. We can detect this fake reversal with the RSI indicator.
At the point of Breakout, the RSI indicator shows the over-bought of assets. So, it is not right for Sol To go more up. That’s why this is a fake breakout. In the above figure, you can see that the indicator shows that this trend reversal is fake.
Give a detailed explanation on the following Trend reversal identification and back up your explanation using the original chart. Do this for both bullish and bearish trends (Screenshots required).
There are several trends patterns that the market follows to make a trend. In the same way when market price breaks the trend structure then trend reversal is happening. We will discuss every trend reversal method and understand with visuals.
a) Break of market structure
This is one of the trend reversal methods. As we know that the price breaks the trend in both upward and downward directions. So, we will discuss both bearish and Bullish trend reversal by breaking the market structure.
Bullish Reversal
In this trend reversal method, the price is going up. When the market price current high is higher than the previous high and the current low is higher than the previous low it is a market structure that the market is following to bring the price to its peak.
When the current high is not higher than the previous high and the current low is not higher than the previous low then it indicates that the boost force behind the price is weak that is not able to bring the price further up. This is why after violation of structure the price goes down.
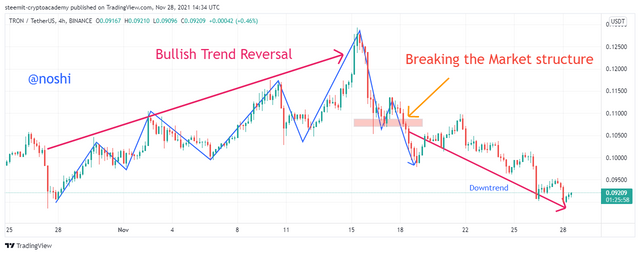
In the above figure, you can see the market price following the structure in which it made highs higher than the previous high and low higher than previous lows. In this way, the price moves up. But when the current high is not higher than the previous high and the current low is not higher than the previous low then it breaks the structure and the price goes down after violation of structure.
Bearish Reversal
In this trend reversal method, the price is going down. When the market price current low is lower than the previous low and the current high is lower than the previous high it is the market structure that the market is following to bring the price down.
When the current low is not lower than the previous low and the current high is not lowered than the previous high then it indicates weakness of boost force behind the price that is not able to bring the price further down. This is why after violation of structure the price goes up.
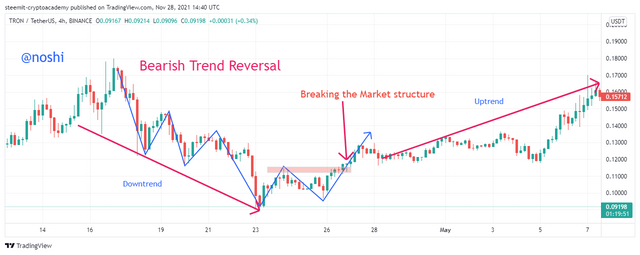
In the above figure, you can see the market price following the structure in which it made lows lower than the previous low and high lower than the previous high. In this way, the price moves up. But when the current low is not lowered than the previous low and the current high is not lower than the previous high then it breaks the structure and the price goes up after violation of structure.
b) Break of Trendline
The trend is also a trend-making structure. It also works in both bearish and bullish markets. We will understand and detect reversals in both bearish and bullish directions.
Bullish Trendline Reversal
The trendline is a very common tool that is used in doing several technical analyses. When prices continuously move upward direction then we draw a line under the price of assets on the chart. When the price is moving up by following the path of the trendline then it indicates the market is on an uptrend.
When market price lows test the trendline under the price several times and not break the trendline then, it indicates the market price follows the trendline and the price goes up. But when the low market price breaks the trend line, it indicates the weak force of buyers that is not able to push the price more up. This is why the price is going down after breaking the bullish trendline.
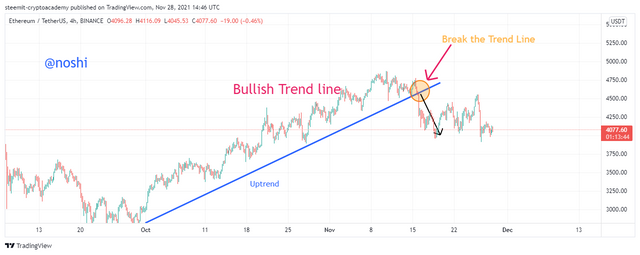
In the figure, you can see that the market price lows test the trendline several times but do not break the trendline. It indicates the strong buying force behind the price. This is why the price moves up. But as we can see in the figure, when the price breaks the trendline it indicates the bullish trend reversal. The price after the breakout is going down.
Bearish Trendline Reversal
Bearish Reversal is the same but in opposite direction. When the price continuously moves down then we draw a line above the price of an asset on the chart. When the price is moving down by following the path of the trendline then it indicates the market is on a downtrend.
When the market price test, again and again, the trendline above the price and does not break the trendline then, it indicates the market price follow the trendline and the price is going down. But when the market price breaks the trend line to the upward direction, it indicates the weak force of sellers that is not able to push the price further down. This is why the price is going up after breaking the bearish trendline.
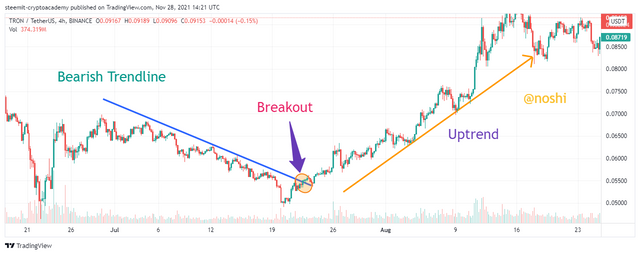
In the figure, you can see that the market price tests the trendline several times but does not break the trendline. It indicates the strong selling force behind the price. This is why the price moves up. But as we can see in the figure, when the price breaks the trendline it indicates the bullish trend reversal. The price after the breakout is going down.
c) Divergence
Divergence is a conflict between the asset price and indicator value. It is also noticed in both bullish and bearish markets. We will understand and detect both bearish and bullish trend reversal.
Bullish Divergence
When the price is moving and indicator movement shows the bullish movement then it indicates the bullish divergence. We draw a line under the price low and indicator lower edges in a particular time. When the price line makes an angle greater than 180 then the indicator lower line makes an angle high than 180 then it indicate the divergence. After bullish divergence, the price will be taken off to an upward direction.
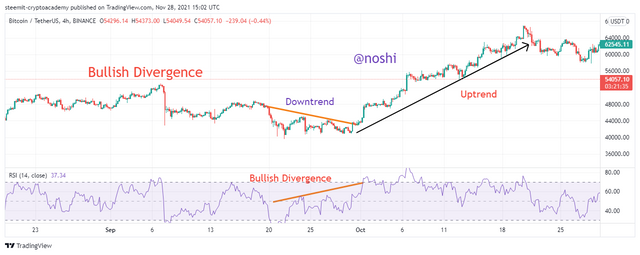
In the above figure, you can see that the price of an asset is moving down and the indicator shows bullish or opposite movement. This shows the bullish divergence. We notice that after this divergence the price goes up.
Bearish Divergence
When the price is moving up and Indicator is moving down then, it indicates the bearish divergence. We draw a line above the price low and indicator higher edges in a particular time. When the price line makes an angle lower than 180 then the indicator lower line makes an angle lower than 180 then it indicates the bearish divergence. After bullish divergence, the price will start moving downward direction.
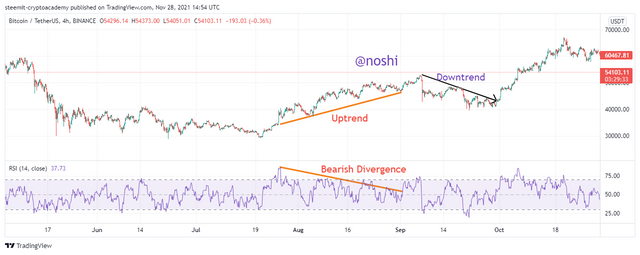
In the above figure, you can see that the price of an asset is moving up and the indicator shows a bearish or opposite movement. This shows the bearish divergence. We notice that after this bearish divergence the price goes down. This is how we can determine the trend reversal by using the Divergence.
d) Double top and Double bottom
Double top and Double bottom are trend reversal identifying methods that traders use to set their entries and exit point. This structure is also formed in both bullish and bearish markets. We will understand and detect trend reversal after forming a double top and double bottom in the market.
Double Top
The double top structure is made in a bullish market. In this pattern, the price continuously moves in an upward direction and makes the higher highs. Then at peak market break the structure after making the high and goes down and again move for making the new high. But second, the price is not able to make a new high due weak buying force behind the price. It comes close to the precious top and pulls back. There are two conditions that satisfied the double top pattern.
- Second time, the price must not break the previous top.
- The closing price of the second top must the lower than the closing price of the first top.
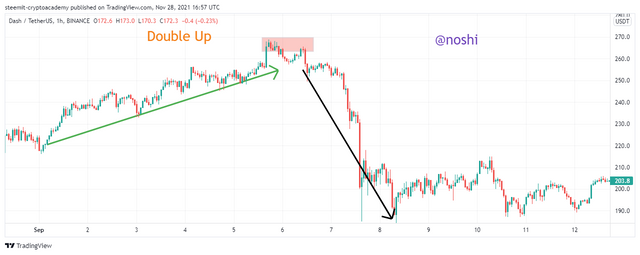
In the above figure, you can see that price is moving up and making the first top. Again price move and ready for making the second top. The second time, it moved up and make high lower the previous top. In this, it satisfied the condition of a double top. When this structure is satisfied then we can see that the price is moving down. In this, we can make sell trade by using the Double top pattern.
Double Bottom
The double bottom structure is made in a bearish market. In this pattern, the price continuously moves in a downward direction and makes the lower lows. Then at a lower peak market break the structure after making the low and goes up. It again moves down for making the new low. But the second time the price is not able to make a new low due weak selling force behind the price of the asset. It comes close to the precious low and pulls back. Like the double top, there are also two conditions that satisfy the double pattern.
- Second time, the price must not break the previous lower top.
- The closing price of the second top must the higher than the closing price of the first lower top.
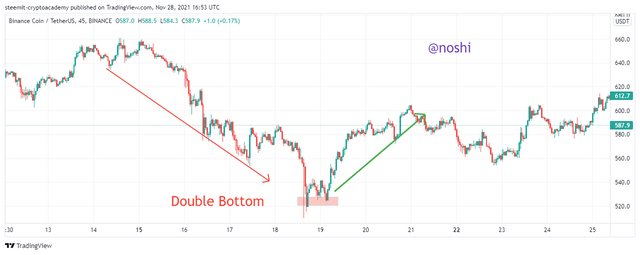
In the above figure, you can see that price is moving down and making the first lower top. Again, the price moves up and is ready for making the second lower top. But the second time, it moved down and make a low higher than the previous lower top. In this, it satisfied the conditions of a double bottom. When this structure is satisfied then we can see that the price is moving up. In this, we can make buy trade by using the double bottom pattern.
place a demo trade using any crypto trading platform and enter a buy or sell position using any of the above-mentioned trend reversal/continuation pattern.
We can use these trend reversals for making buy and sell entries. I will use Trendline Reversal for by Buy trade. And I chose the Trend Reversal method for my Sell trade.
Buy Trade
I chose BTC/ USDT pair for a buy trade. I figure out the bearish trendline in the chart. In the following figure, you can see that I draw a bearish trendline. The price touch trendline for three and pull back after touching the trendline. Price goes down. But when they try to break the trend line then I place buy trade with risk management.
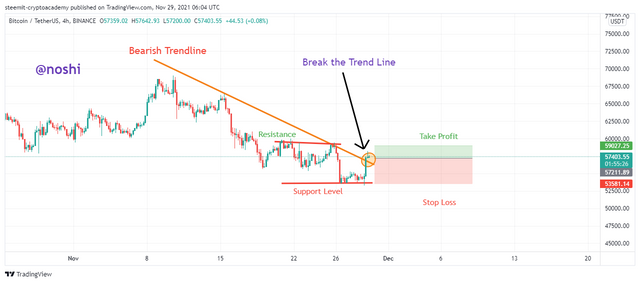
Entry point = $ 57211.89
Stop loss= $ 53581.14
Take Profit= $ 59027.25
Risk reward = ½
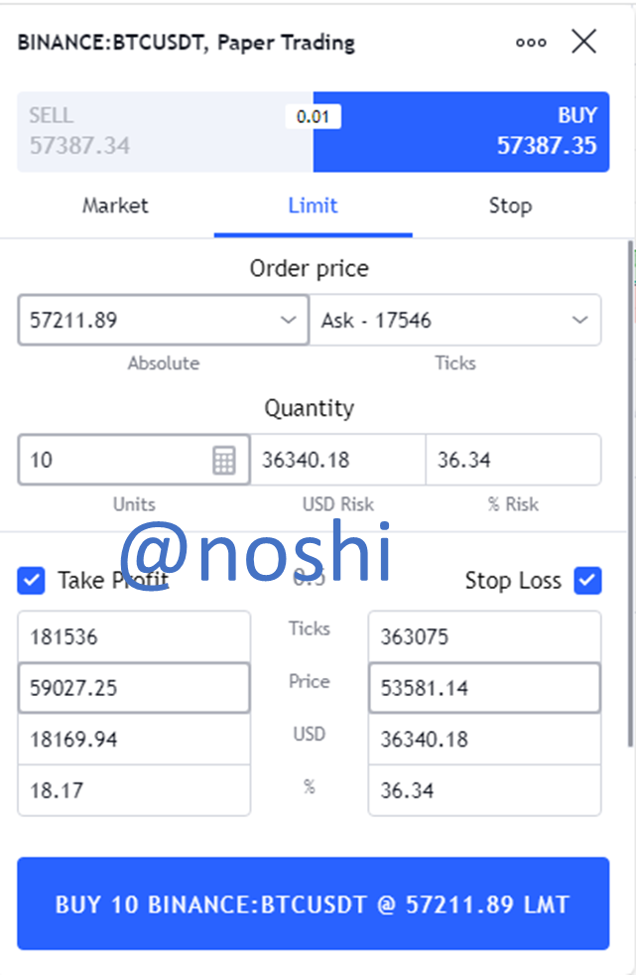
I use a paper trading platform for my demo trade. You can check my trade detail in the following figure.
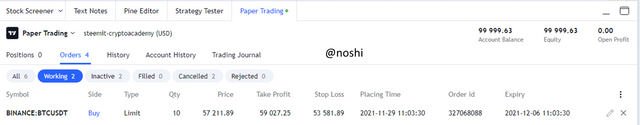
I place a limit buy order in the market. So, you can check the order is placed in paper-trading in the following figure.
Sell Trade
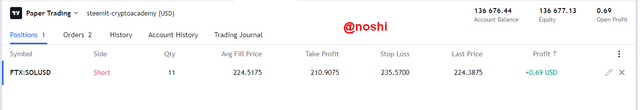
I chose SOL/ USD pair for a sell trade. I figure out the bullish trendline in the chart. In the following figure, you can see that I draw a bullish trendline. The price touch trendline more than one time and pull back after touching the trendline. Price goes up. But when they try to break the trend line then I place sell trade with risk management.
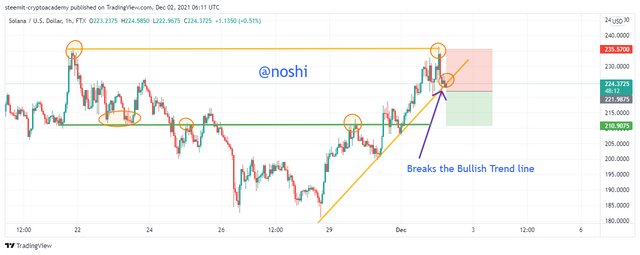
Entry point = $ 221.9875
Stop loss= $ 235.5700
Take Profit= $ 210.9075
Risk reward = 1
I use a paper trading platform for my demo trade. You can check my trade detail in the following figure.
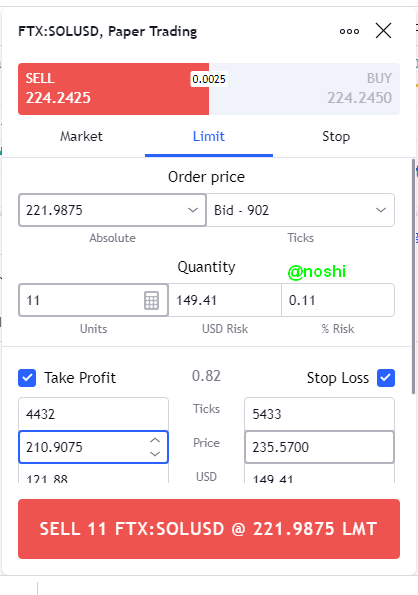
I place a limit buy order in the market. So, you can check the order is placed in paper-trading in the following figure.
Trend and trend reversals are made in the market. Traders and investors take profit from these market trends and trend reversals. It is not fully sure that after the trend reversal happens. That’s why it is still very risky. Sometimes market is moving in an unexpected direction.
So, it needs the full attention of analyses of fundamental and technical. We should use technical indicators for detecting the exact trend reversal and figure out fake trend reversals. It is recommended to pair of indicators. The alone indicator is not enough of detecting the exact signal.
Hello @noshi , I’m glad you participated in the 3rd week Season 5 of the Beginner’s class at the Steemit Crypto Academy. Your grades in this task are as follows:
Observations:
This is not a clear example of a divergence.
Recommendation / Feedback:
Thank you for participating in this homework task.