Trading Crypto with Aroon Indicator- Crypto Academy / S5W2 - Homework Post for @fredquantum.

This is a great lecture on Aroon Indicator. I have learned a lot of things like what is Aroon, how it works, how to trade, and how to figure out false signals. This indicator will be very helpful for the trader in the crypto market. Professor explains well this indicator. I also try to answer all the questions. I hope it will help you more to understand this indicator.

What is Aroon Indicator in your own words? What are Aroon-Up and Aroon-Down? (Show them on Chart).
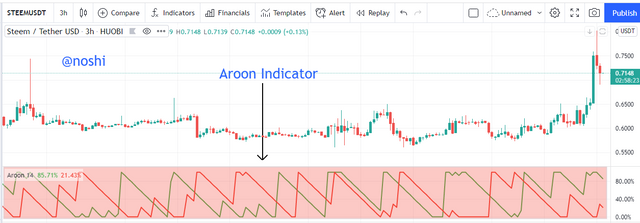
Aroon Indicator is a technical analyses tool that is created by Tushar Chande. It is created in the year 1995. As always, this indicator is also calculating its values by considering the prior price record of an asset. Aroon Indicator is used to determine the current trend in the market. Traders use Arron Indicator by taking positions in the market by observing the movement of indicators.
Trader determines not only to determine the trend in the market, but it also measures the strength of the trend whether the market is on a downtrend or uptrend. It shows the results after measuring the data over a specific period. A number of periods can be changed according to the trading situation. Aroon Indicator value scale is lies between the (0-100). It measures the trend and strength of a trend in both upward and downward directions.
Aroon indicator comprised of two oscillating lines. One is Aroon-Up and the Second is Aroon-Down. These lines show the different results as market price moves. These lines are oscillating between the range of 0-100. We will understand Aroon-Up and Arron-down with examples below section.

Aroon-Up
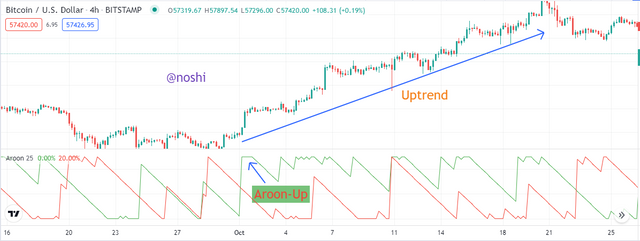
The Aroon-Up line is indicating the uptrend in the market price of an asset. It is oscillating between the 0-100 range. The strength of the market trend is determined by observing the line scale number. When the line is moving toward 100 scales, then we can say that the market is on an uptrend and the trend is strong. When the market is on an uptrend then the Aroon-Up line lies above the Aroon down line.
In the above figure, you can see that in the chart section the market price is on an uptrend. When we look at the indicator section, the green line Aroon-up line that indicates the uptrend movement in the market and scale values shows that the trend is strong.

Aroon-Down
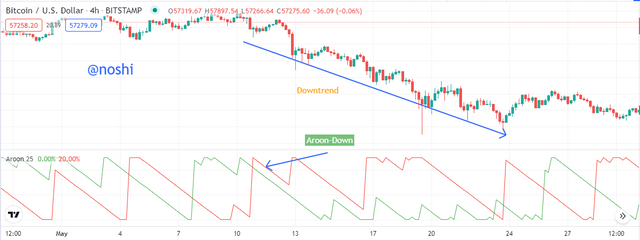
The Aroon-Down line is indicating the downtrend in the market price of an asset. It is oscillating between the 0-100 range. The strength of the downtrend is determined by observing the line scale number. When the line is moving toward 100 scale indexes, then we can say that the market is on a downtrend and this downtrend is strong. When the market is on a downtrend then the Aroon-Down line lies above the Aroon-Up line.
In the above figure, you can see that in the chart section the market price is on a downtrend. When we look at the indicator section, the red line Aroon-Down line that indicates the downtrend movement in the market and scale values shows that the trend is strong.

How is Aroon-Up/Aroon-Down calculated? (Give an illustrative example).
The value of Aroon-Up and Aroon-Down is calculated in the form of percentages. For this, we will consider a specific time period. Normally we consider the 25 periods set. Both values are calculated by considering the highest and lowest price of the period within the specified period set.
For instance, we set the indicator period setting at 25 periods. It means it considers the last 25 periods or candles on the chart. Now we will see that how it calculates the values. I will demonstrate all the processes in a theoretical, mathematical, and graphical way.
Aroon-Up Calculation
Aroon-Up represents the uptrend in the market. After applying the indicator on the chart, I change the period setting from 14 to 25. Because I want to calculate the 25 periods trend.
The formula of Aroon-Up calculation.
According to a formula that is mentioned in the figure, we subtract the highest price period No from 25 and then divide the answer by 25. Next, we multiply the answer by 100 as shown in the figure. In this way, we will calculate the Aroon-Up value.
Aroon-Up = (25 – Highest price candle Number from Previous 25 Periods) /25 x 100
In the above figure, you can see that set the indicator period setting to 25 periods on the pair of TRX/USDT. I open 1 DAY chart. The current period is dated 26 November. The last 25 periods range ends on the 1st of October. As you can see that, the highest period is highlighted on the chart. When we calculate the number of periods from the current period that is 14th. Now we will calculate the Aroon-Up value by putting the values in the formula.
Aroon-Up = (25 – Highest price candle Number from Previous 25 Periods) /25 x 100 /
- Aroon-Up = (25 – 11)/25 x 100
- Aroon-Up = 14/25 x 100
- Aroon-Up = 0.56 x 100
Aroon-Up = 56.00%
In the above figure, you can clearly see that the same result is displayed by the Aroon-Up Line. In this way, we calculate the Aroon-Up values by using the formula.

Aroon-Down Calculation
The formula of Aroon-Down calculation.
Aroon-Down = (25 – Lowest price Period Number from Previous 25 Periods) /25 x 100
According to a formula that is mentioned in the figure, we subtract the Lowest price period No. from 25 and then divide the answer by 25. Next, we multiply the answer by 100 as shown in the figure. In this way, we will calculate the Aroon-Down value.
In the above figure, you can see that the current period is dated 26 November. The last 25 periods range ends on the 1st of October. As you can see that, the lowest period is highlighted on the chart. When we calculate the number of periods from the current period that is 2nd. Now we will calculate the Aroon-Down value by putting the values in the formula.
Aroon-Down = (25 – Lowest price Period Number from Previous 25 Periods) /25 x 100
Aroon-Down = (25 – 2)/25 x 100
Aroon-Down = 23/25 x 100
- Aroon-Down = 0.92 x 100
Aroon-Down = 92.00%
In the above figure, you can clearly see that the same result is displayed by the Aroon-Down Line. In this way, we calculate the Aroon-Down values by using the formula.

Show the Steps involved in the Setting Up Aroon indicator on the chart and show different settings. (Screenshots required).
I chose the TradingView site for applying the Aroon Indicator on the chart. Applying and setting the Aroon Indicator on the chart, you need to do the following steps.
- Open the chart of Specific crypto pairs.
- Click on the fxButton.
- Next write the name of the indicator that is Aroon.
- Select the first result as shown in the figure.
Screenshot fromTradingView
Screenshot fromTradingView
In this way, we can apply the Aroon Indicator on the chart.

Settings of Arron Indicator
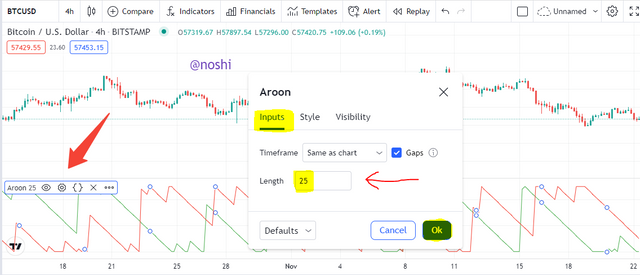
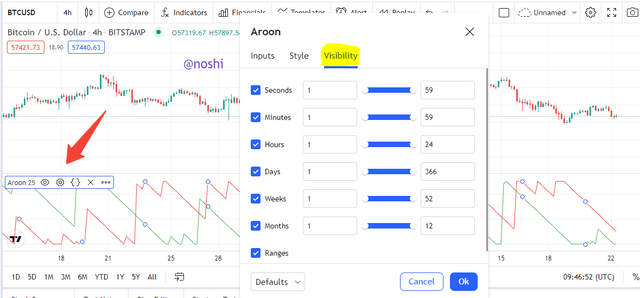
To change the setting of the indicator, you need to click on the indicator, and then the Setting button is appeared, Click on it. There are three settings that we can change on the chart. We will discuss it one by one.
Input Setting
In this setting, we can change the timeframe of the indicator. By default, the timeframe is the same as a time period. We can change the length of periods here. By default, the period length is 14. I change it to 25. Because I want to calculate and determine the trend from the last 25 periods.

Style Setting
In this setting, we can change the color scheme of the indicator. We can change the color of Aroon-Up and Aroon Down Lines. By default, the Aroon-up color is Red and Aroon Down color is green. I change both lines' colors.

Visibility Setting
In this setting, we can select the item that we want to display on the indicator. In the setting, you can see that different item are displayed. We can let them appear and disappear by clicking the checkbox. These are the settings that we can change in the indicator.

What is your understanding of the Aroon Oscillator? How does it work? (Show it on the chart, kindly skip the steps involved in adding it).
Aroon oscillator is a separate indicator that is based on the Aroon indicator. It uses the Aroon Up and Aroon down values for calculating the Aroon Oscillator values. It is also developed by Tushar Chande. It is a single oscillating line that indicates the trend. It is also used to determine market trends and the strength of trends. You can see in the below figure what how the Aroon oscillator looks like.
Formula
In the above figure, you can see that both indicators are applied. It Aroon Oscillator value is calculated after subtracting the Aroon-Down Value from the Aroon-Up value.
Aroon Oscillator = Aroon-Up – Aroon- Down
You can see in the figure that how it is calculated. The current values of the Aroon Oscillator are -36. In the figure, I mention that how it is calculated.

Working
The line of this indicator oscillates around Zero-line between the range of -100 to +100. When the oscillating line is on the positive side then we can say that the market is on an uptrend. The strength of the trend is depending on the value of the percentage. If the value of the percentage is higher than +80%, then we can say that the market is on a strong Uptrend.
If the value of the percentage is higher than -80%, then we can say that the market is on a strong downtrend. When cross 0 lines from bottom to upward direction then it indicates the buy signal. On contrary, when cross 0 line from up to bottom direction then it indicates the Sell signal.

Applications
We can use Aroon Oscillator for trading. When the oscillator line crosses 0 from bottom to up then it indicates the buying opportunity. When the line cross 0 from Up to the bottom side then it indicates the Sell opportunity.
In the above figure, you see that we Buy and Sell Signal are formed. In the buy signal of the Aroon Oscillator. After that, we can notice that the price of assets is going up after that buy signal. In the sell signal of the Aroon Oscillator, the price of an asset is on the Downside of the MA indicator. After that, we can notice that the price of assets is going down after that sell signal.

Consider an Aroon Indicator with a single oscillating line, what does the measurement of the trend at +50 and -50 signify?
The Aroon Indicator with a single line comprised of only one oscillating line. We can say that it is an Aroon Oscillator. When we apply this indicator on the chart it displays more than one line that is plotted parallelly. The default setting of these lines are 40 and -40 other lines are plotted on 100 and -100.

According to the requirement of the question, I change the setting of one line that is plotted on both negative and positive lines. I change the 40-line settings to +50 and -50. You can see this in the above figure.
These additional lines are plotted the determine the strength of the trend. If the Oscillating line is below the +50 line, then we can say that market is on a loss uptrend. But when the Oscillating line is above the +50 line, then we can say that market is on a Strong Uptrend.
In the figure, you can see that the oscillating line is above the +50 line. At the same time, we can see that the price of assets is on a strong Uptrend. In this way, we can measure the strength of the uptrend by using the Aroon indicator with a single line.
If the Oscillating line is above the -50 line, then we can say that market is on a loss Downtrend. But when the Oscillating line is below the -50 line, then we can say that market is on a strong downtrend.
In the figure, you can see that the oscillating line is above the -50 line. At the same time, we can see that the price of assets is on a Strong Downtrend. In this way, we can measure the strength of the downtrend by using the Aroon indicator with a single line.

Explain Aroon Indicator movement in Range Markets. (Screenshot required).
Aroon indicator helps the trader to figure out the buying and selling signals. Traders identify the trend and strength of a trend by using the Aroon indicator. Market price makeups and downs. When the market price is going up and down, at the same using the Aroon indicator lines cross each other that produce buy and sell signals. But sometimes market price makes ups and down within the little up and down boundaries.
In other words, we can say that the market price is going in sideways movements. Aroon indicator helps the traders to find out the exact market movement. When the market is on sideways movement, it indicates that there is no trend in the market. When the market moves in sideways at the same time Aroon indicates Up and Down lines show the parallel behavior. It means that Aroon-Up and Aroon-Down lines are travel parallelly.
They cannot intercept each other when the market price is going through ranging scenarios. In the above figure, you can see that in the chart section the price makes sideways movements. We can confirm the sideways movement by observing the indicator behavior. We can see that the both Aroon and Aroon Down lines are travel parallelly. In this situation, we should avoid buying and sell or assets. Because in this scenario, there is no trend in the market.

Does Aroon Indicator give False and Late signals? Explain. Show false and late signals of the Aroon Indicator on the chart. Combine an indicator (other than RSI) with the Aroon indicator to filter late and false signals. (Screenshots required).
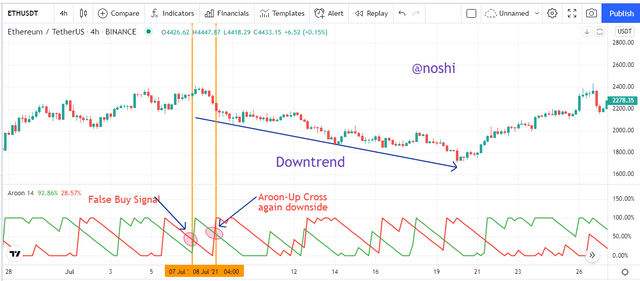
Like every indicator, Aroon Indicator is not a hundred percent sure for trading. It gives us false and late buying and selling signals. False signals produced by Aroon indicator. When the market is on an uptrend and the indicator shows the opposite signal. When the market is going down but the indicator shows the wrong crossover Buy Signal.
False Buy Signal
In the above figure, you can see that the Aroon-Up intercepts the Aroon-Down from bottom to upward direction that indicating the uptrend. But in the chart section, we can see that the market is on a downtrend. It is a false buy signal that is produced by the indicator by the wrong crossover.

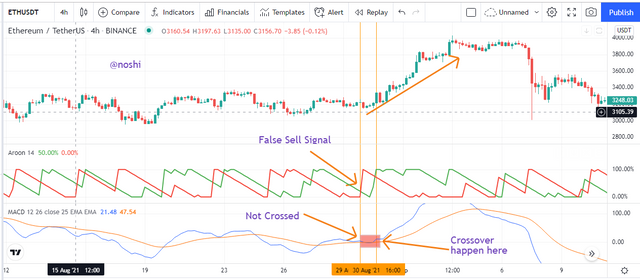
False Sell Signal

In the above figure, you can see that the Aroon-Up intercepts the Aroon-Down from up to bottom direction that indicating the downtrend or sell signal. But in the chart section, we can see that the market is on an Uptrend. It is a false sell signal that is produced by the indicator by the wrong crossover.

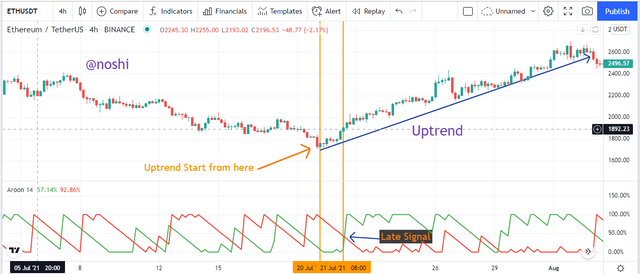
Late Signal Buy Aroon Indicator
When the market already made a trend but the Aroon indicator pick this already establish trend after a while. We can say that when the market is already is on an uptrend but the indicator shows the uptrend or buys signal after a few times. It is a late signal that is produced by the indicator.
In the above figure, you can see that the market is already on an uptrend. But the indicator shows the uptrend or buy signal after a few times. The production of Aroon lines crossover is late. In this way Aroon indicator show late buy signals.

Aroon with MACD Indicator
I use the MACD indicator with the conjunction of the Aroon indicator. By using the MACD indicator, we can figure the false or late signals that are produced by Aroon Indicator. By using this indicator, we should avoid making an entry at false break out and crossovers of Aroon Indicators. We confirm the market movement by MACD indicator.
Detect False Signal
Sometimes Aroon Indicator produces a false signal. Traders get trapped in this situation. When the market price is in an uptrend and the Aroon indicator produces the sell signal then we call it a false signal that is produced by the Aroon indicator. So, this is why we use the MACD indicator as a conjunction to eliminate the false signals.
In the above figure, you can check the market price on an uptrend. But when looking at the Aroon indicator, it produces a Sell signal by making the wrong crossover of Aroon-down from bottom to up. We confirm this signal by using the MACD indicator.
When we look at the MACD indicator, it shows the uptrend signal by making the right crossover of the blue line from the bottom to the upward direction. After that, the market price is going up. In this way, we can eliminate the false signals of Aroon.

Detect Late Signal
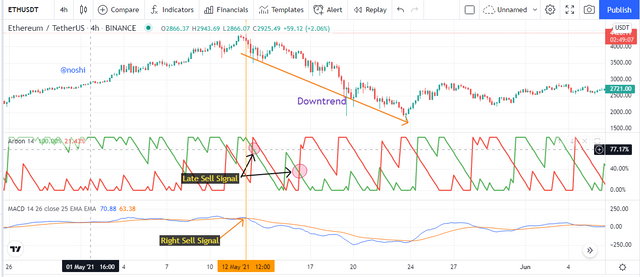
Sometimes Aroon Indicator produces Late buy and sell signals. When the market price is already on an uptrend and the Aroon indicator produces the uptrend signal after a while, then we call it a late signal that is produced by the Aroon indicator. So, this is why we use the MACD indicator as a conjunction to eliminate the Late signals.
In the above figure, you can check the market price is already on a downtrend. But when looking at the Aroon indicator, it produces sell and downtrend market signals after a while. In this situation, traders lose the Sell opportunity due to a late signal. We can use the MACD indicator to fix the late signal problem.
When we look at the MACD indicator, it shows the downtrend signal at right time you can compare both market price and MACD downtrend signal, both are placed at the same time by making the right crossover of the blue line from up to downward direction. After that, the market price is going down. In this way, we can fix the late signals of the Aroon.

Place at least one buy and sell trade using the Aroon Indicator with the help of the indicator combined in (7) above. Use a demo account with proper trade management. (Screenshots required).
In the previous question, I use the MACD indicator for determining the false and late signals that are produced by the Aroon indicator. Now in this question, I will use the MACD indicator for placing the buy and sell orders. I use the Macd indicator for confirmation of the Sell or buy signal that is giving the Aroon indicator. In this way, we can get a better trading experience by using the combination of two indicators.
Sell Order
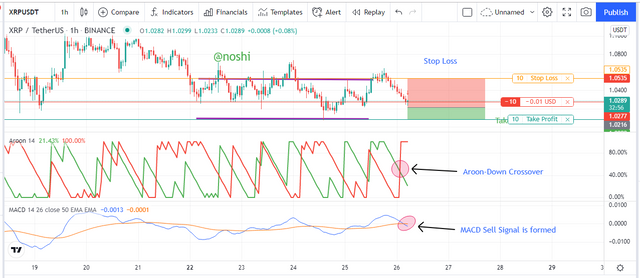
We place sell orders when the market is on an uptrend and ready for trend reversal. So, in order to save our profit and we place sell orders with proper trading management and risk management. I place a sell order here using the chart of XRP/USDT. Stop Loss is applied on the upper is side and Take profit on the lower side of the entry point.
In the figure, you can see that the sell signal is produced by Aroon Indicator by showing the crossover of the Aroon-Down crossover toward the up direction.
For the confirmation of this signal, we use the MACD indicator with 50 length settings. At the same time as the Aroon Sell signal, the MACD indicator also shows the crossover which indicates the sell signal of the Aroon indicator is right. In this way, I place a sell order here with the entry price of $1.0268 and Stop Loss $1.0535 and Take Profit level is $ 1.0080.

In the above figure, you can check all the details about the Sell order.
Here in the following figure, my Sell order that I place using Paper Trading.


Buy Order
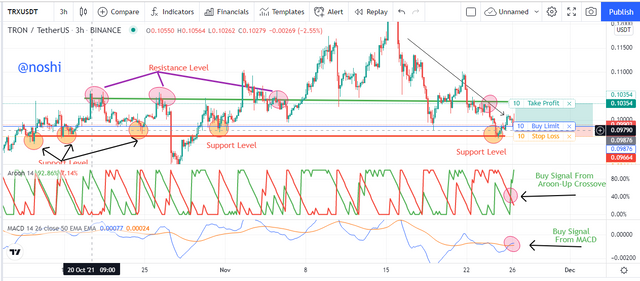
We place buy orders when the market is on a downtrend and ready for trend reversal. So, in order to the right time to buy, we place buy orders with proper trading management and risk management. I place a buy order here using the chart of TRX/USDT. Stop Loss is applied on the lower side and Take profit on the upper side of the entry point.
In the figure, you can see that the Buy signal is produced by Aroon Indicator by showing the crossover of Aroon-Up toward the upward direction.
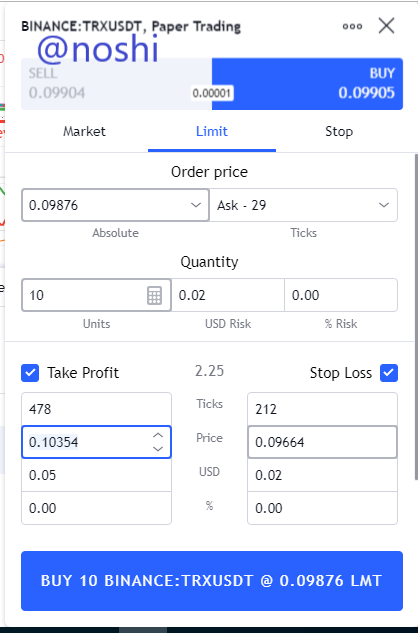
For the confirmation of this signal, we use the MACD indicator with 50 length settings. At the same time as the Aroon buy signal the MACD indicator also shows the crossover which indicates the buy signal of the Aroon indicator is right. In this way, I place a buy order here with the entry price of $0.09876 and Stop Loss $0.09664 and Take Profit level is $ 0.10354.
In the above figure, you can check all the details about the buy order.
Here in the following figure, my buy order that I place using Paper Trading.

State the Merits and Demerits of Aroon Indicator
Merits
- It is very easy to use.
- We can determine the current trend in the market.
- The Strength of the Trend is also determined by using the Aroon indicator.
- Buy and Sell entry positions are figured out by Aroon Indicator.
Demerits
- Aroon Indicator alone is not sufficient for trading.
- It is a lagging indicator that produces false buy and sells signals.
- It produces late buying and selling signals that caused loss of the position.

Aroon indicator is an indicator like other indicators. It is also a technical tool that is used by traders while doing technical analyses in the market. This indicator is very easy to use. It has two oscillating lines. One indicates uptrend movement and the second indicates the downtrend movement.
Aroon indicator helps the trader to make an entry and exit into the market by observing the movement and crossovers of oscillating lines of the Aroon indicator. Traders also use this indicator to figure out false signals. The best way to use this indicator is to use this indicator with another indicator. In this way, the trader confirms every type of signal and false breakout by using more than two indicators.

