Steemit Crypto Academy Season 2-Week6 Cryptocurrency Trading with MACD indicator for @kouba01
Hello my dear colleagues, today I am writing my homework task for dear professor @kouba01. This lecture has been much informative as we have learnt briefly about MACD and its functions. I hope we will learn more in future.
%20(1).png)
 What is the MACD indicator simply? Is the MACD Indicator Good for Trading Cryptocurrencies? Which is better, MACD or RSI?
 p
p
MACD stands for Moving Average Convergence Divergence. MACD is a momentum indicator that demonstrates a relationship between moving averages by following trends. Like RSI, it is one of the technical indicators used by investors to study trends (strength & direction), potential entry and exit points and potential market prices. This works on the phenomenon of convergence and divergence that are essential indicators used in market analysis.
𝑀𝐴𝐶𝐷 = 12 𝑃𝑒𝑟𝑖𝑜𝑑 𝐸𝑀𝐴 − 26 𝑃𝑒𝑟𝑖𝑜𝑑 𝐸𝑀𝐴
Here, EMA is Exponential Moving Average that refers to moving average placing more weight and importance on recent data points.
Yes, MACD is good for crypto trade because it has necessary functions that include assessment of direction and strength of trends, potential entry and exit points in trade and identification of price reversals. But I don’t prefer one over another. It is because I like a combination of both. MACD and RSI are both momentum indicators, MACD shows a relation between moving averages while RSI shows a flux in price in relevance to low’s and high’s. If both are combined, a much clear technical analysis of market can be produced.
How to add the MACD indicator to the chart, what are its settings, and ways to benefit from them? (Screenshot required)
To set up MACD indicator in a price chart, I will use Binance application and tell you how we can configure it and what its benefits are. I will demonstrate you step wise:
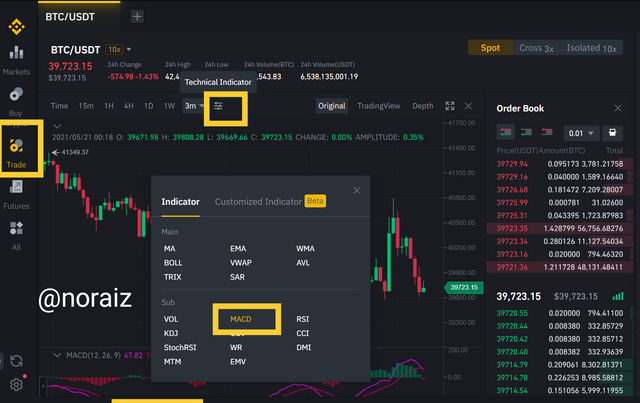
STEP I
Open Binance application and click on trade. Here you can see an option of Technical Indicator, click it.
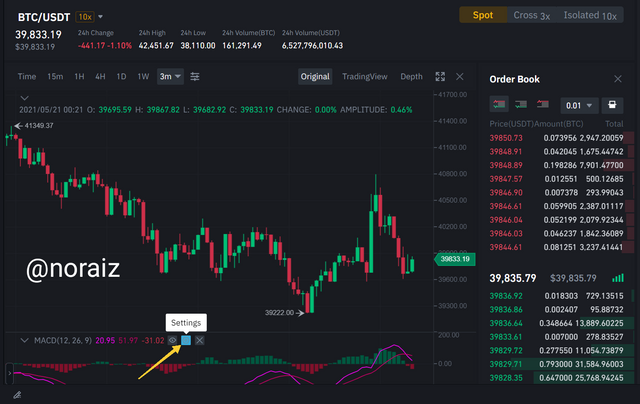
STEP II
Now we check how to configure MACD. So once you Select MACD, you can see a settings icon just next to your MACD values, click on this settings icon.
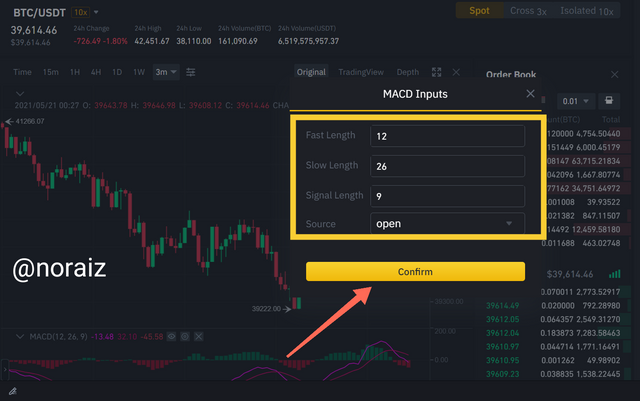
STEP III
Once we click settings, now a small window will open that will show MACD inputs. I have set it to 12, 26 and 9. Now click confirm and you can see the MACD values on chart.
Benefits of adjusting MACD inputs
The main advantage of configuring MACD inputs is that we can obtain results as per our convenience. In most price chart, the signal length is adjusted to 9 because it gives quicker indications according to the direction of trends. Display of Histogram helps traders to assess market trends in no time.
(All screen taken from binance application)
How to use MACD with crossing MACD line and signal line? And How to use the MACD with the crossing of the zero line?
Use of MACD with crossing MACD line & Signal Line
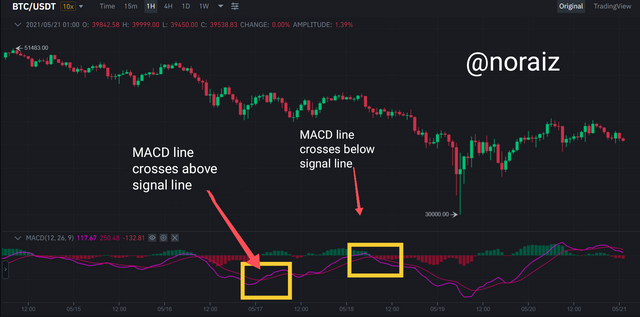
I will demonstrate crossing of MACD line and Signal line with the help of a BTC/USDT price chart. See below
 Screen taken from Binance application
As you can see above that MACD line has crossed above signal line, this means there will be two situations:
Market will enter bullish phase.
Assets will be bought more.
Similarly when MACD line has crossed below signal line, this means there will be two situations:
Market will enter bearish phase.
Assets will be sold more.
Use of MACD with crossing zero line
Zero line is a centre line dividing positive and negative area on price chart.
When MACD crosses zero line following a below upward trend, then there will be two situations:
Market will enter bullish phase.
Assets will be bought more.
When MACD crosses zero line following a above downward trend, then there will be two situations:
Market will enter bearish phase.
Assets will be sold more.
How to detect a trend using the MACD? And how to filter out false signals? (Screenshot required)
Detection of trends using MACD
Trends can be detected easily by observing the histogram and crossing of MACD lines and signal lines.
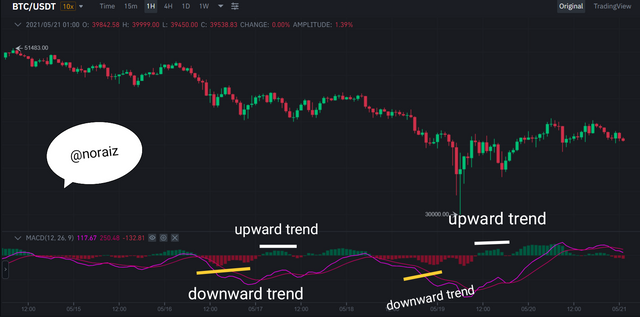
As we can see in above image, there are two clear trends, one upward and other downward and after one trend ends, another trend initiates and so on. This is basically a genuine principle in trade that when trends go up, they are likely to go down after a while and it can be see above. When histogram bars tend to become higher, it indicate price increase and when the histogram bars tend to become lower, it is likely to show another trend now, which is downward. So price reversals and bearish or bullish trends can be traced by using these histogram illustrations.
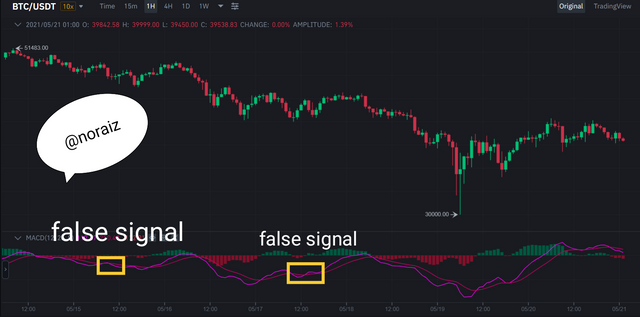
Filtering out false signals during detection of trends
False signals are a major issue in detection of trends. Traders often get ambiguous when they encounter false trends and these false trends can be due to different reasons either from irregularities in data sources, time lags, and algorithm of indicator or methods of smoothening. Some traders use candlesticks as indicators to filter false signals. Reducing noise levels in charts can also filter false signals. Comparison of price trends and MACD lines can also filter false signals. And use of other indicators like Relative Strength Index can also give a more technical picture. Below you can see a false signal:
How can the MACD indicator be used to extract points or support and resistance levels on the chart? Use an example to explain the strategy. (Screenshot required)
Support levels mean such a state when price stop to fall further while on the other hand resistance levels mean such a state when price abruptly stops and is expected to fall. Now I will demonstrate support and resistance levels on a BTC/USDT price chart.
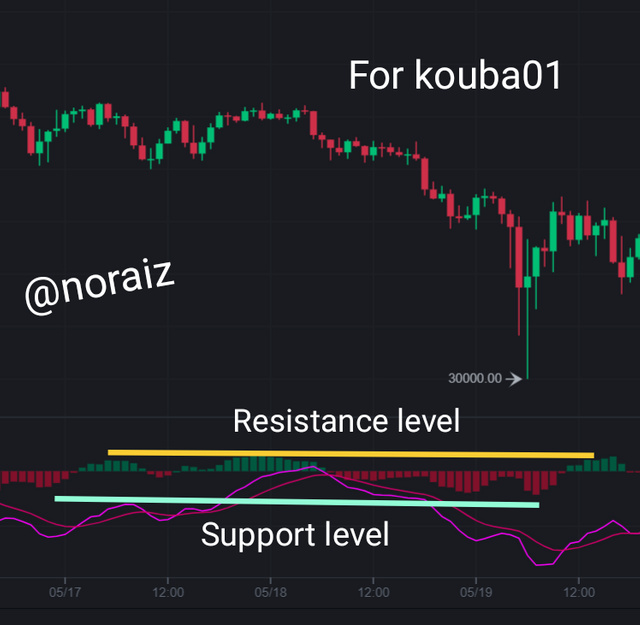
Here we will again take help of the histogram. Downward trends of prices indicate the support levels while upward trends of prices indicate resistance levels. If down peaks are joined, it can give support level and if above peaks are joined, it can give resistance level.
Review the chart of any pair and present the various signals from the MACD. (Screenshot required)
I will use a BTC/USDT to demonstrate various signals from MACD.
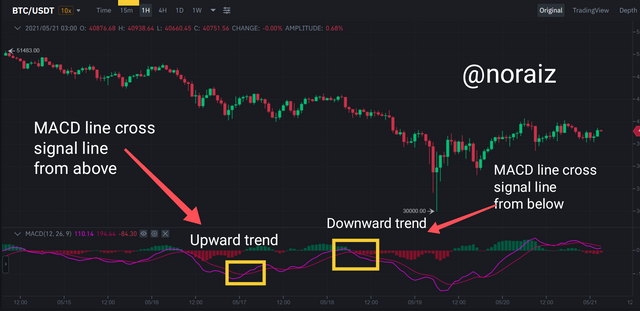
When MACD line crosses signal line from above, it indicates a bullish trend and when MACD line crosses signal line from below, it indicates a bearish trend. In a bullish trend, assets are bought and in a bearish trend, traders sell their assets to avoid losses. We can also see that when MACD line goes up, the price of assets rise and when it goes down, the price of assets fall. These indicators can help to analyze markets.
Conclusion
In this lecture, we have studied detailed information about MACD and how it can be used to analyze market trends, their direction and strength. Moreover, the importance of indicators can save traders from losses. At last, I would recommend to use other indicators such as RSI along with MACD to get a more precise technical picture.
Twitter promotion
Hello @noraiz,
Thank you for participating in the 6th Week Crypto Course in its second season and for your efforts to complete the suggested tasks, you deserve a 5/10 rating, according to the following scale:
My review :
An essay of average content due to the absence of an analysis dimension in most of the answers. Try to spend more effort on research and writing.
Thanks again, and we look forward to reading your next work.
Sincerely,@kouba01