Crypto Academy Week 15, Homework post for [ @yohan2on] Swing trading strategy
Hello my dear colleagues, I hope you all are doing well. I am writing this assignment for my dear professor @yohan2on and as you can understand from the title that my homework task is on Swing Trading Strategy. I hope I shall convey my concepts in an effective way.
SWING TRADING STRATEGY
First of all, it is important to deliver what I have learnt about swing trading strategy and what is its definition for me. Swing trading strategy is defined as a trading practice in which the trades can prolong to weeks where traders interpret swings in market price for their profit. Traders who have studied market for a long time are good at technical analysis and usually save them from loses.
So I would say, that more a technical person is in spotting swings, more is he/she likely to earn profits. Various technical indicators and timeframe charts are used to read market. Shorter timeframe charts tell us about entry and exit points in trade along with stop loss while longer timeframe charts tell us about market trends. Traders use different technique during swing trading, these include reading crossing over of lines, moving convergences and divergences and candle stick analysis.
FEATURES OF SWING TRADING
I would like here to mention some critical features of swing trading and why they are important for traders in market analysis.
As we know that swing trading involve use of technical indicators, so it is more unfailing way to get profits but it needs a lot knowledge and practice to execute successful trades.
It is also observed that swing trading is not as much vexing as day trading. But as we know swing trading lasts for longer periods so traders are prone to risks at that moment.
Swing traders are not likely to follow market trends all time, but use their skills at certain points in which they are more certain to take profits. Here, they plot a strategy and wait for a suitable trend at which they can apply their approach.
MY TECHINCAL ANALYSIS IN SWING TRADING
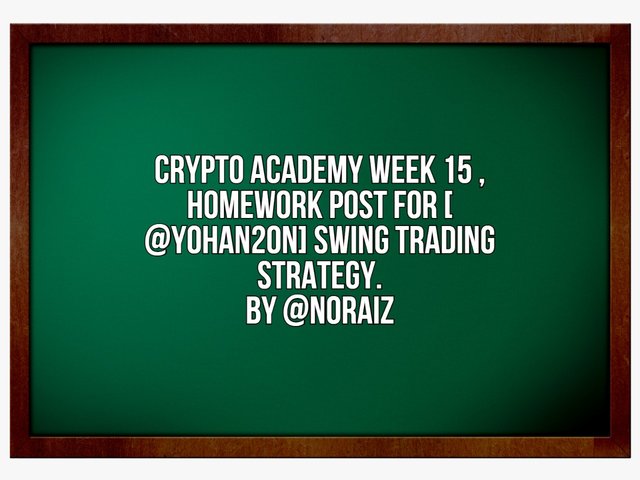
It is important to portray my technical analysis in relevance to swing trading strategy. So I will use a BTC/USDT pair to demonstrate a 1 hour timeframe chart and show how trends vary in market. 1 hour price chart is a very short time frame and tells about entry and exit points in a trade.
In the above 1 hr price chart for BTC/USDT shows a steep downtrend and then a price reversal as below histogram for MACD indicate that signal line is crossed by MACD line where there is high pressure to sell and market is in bullish phase. If we interpret RSI, MACD and Candle sticks, we can see an upward trend, soon after previous downward trend. This is price reversal and prices will tend to go up, where assets will be bought and market will enter bearish phase.
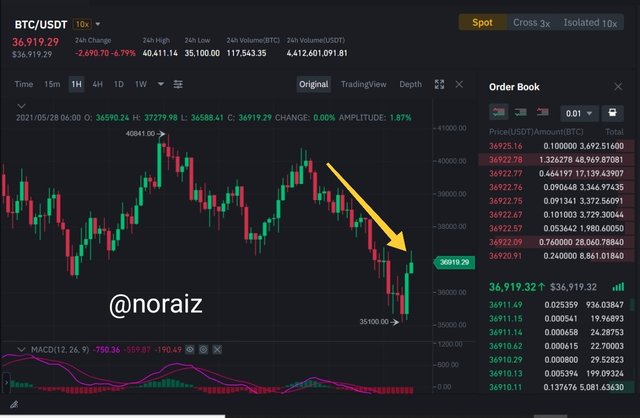
Now I will show you 1 week price chart using same BTC/USDT pair and demonstrate how swing strategy works during longer trades.
In this above 1 week price chart, an upward trend is observed in the beginning but soon it shows a price reversal and a downward trend begins but it this demonstration is linked with above 1 hr price chart in which after a downward trend, a mere upward trend is observed. We can interpret that, there is price reversal and assets will be bought. Most traders tend to enter trade at this point.
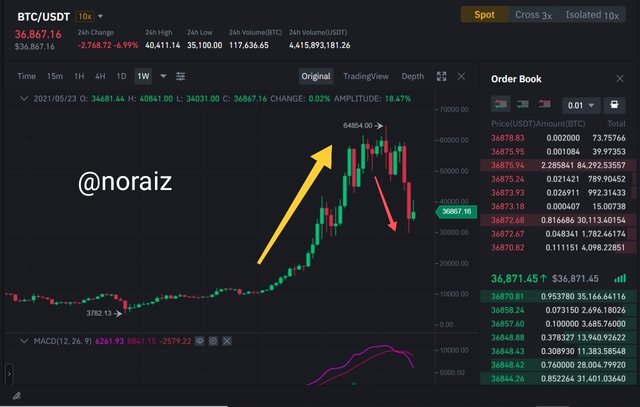
Now I shall show you a longer timeframe chart, which is of 3 months and I will use here, same BTC/USDT pair.
In the above image, you can see that a resistance level is observed and there is a gradual upward trend, then a rest level and after that price reversal occurs and a downward trend starts. Here at this point, the price $36, 839 which is near to same as the price in the end of resistance level. Keen study of candle sticks also help to figure out what actually is the market situation during trade.
USE OF TECHINCAL INDICATORS
As an analyst, I would suggest use of technical indicators such as Relative Strength Index and MACD (Moving Average Convergence and Divergence). These two technical indicators are helpful for me to interpret when market enters bullish and bearish phase and when there is a pressure to buy or sell.
Below you can see my technical indicators that Binance has offered me to use.
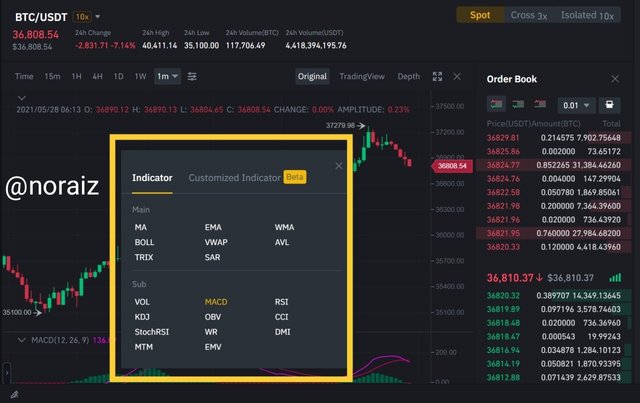
All screen taken from binance

I would suggest traders to invest a certain amount that is bearable to be lost. Usually beginners tend to invest larger assets and are not much good at analysis, regret after they lose. To avoid such calamities, stop losses should be adjust during trade and make a target strategy. At last I would say that, the more we know here, the more we grow here.
CONCLUSION
This week has been an amazing opportunity to learn new concepts and be more practical in market analysis because it is a key to successful trade. Use of technical indicators is much helpful in market forecast and always remember to not forget the past trends, because as we know, price reversal occur here so the coming trends are usually based on previous trends.
Hi @noraiz
Thanks for participating in the Steemit Crypto Academy
Feedback
You lacked a trading plan. When doing a multiple time frame analysis you have to begin from a higher time frame such as the Monthly before looking for trade entries in the lower time frame (1hour). You lacked knowledge of technical analysis and that's why you presented unclear and very short information concerning Swing trading. Put more effort into your work.
Homework task
1.5