Crypto Academy Week 12-Homework post for @kouba01
Today I shall submit my homework to my professor @kouba01 on topic Cryptocurrency Trading with RSI. I have learnt a lot from this lecture and I will make every effort to deliver my concepts.
Cryptocurrency Trading with RSI
 p
p
 Q1: What is Relative Strength Index RSI- and how it is calculated?
RSI (Relative Strength Index) is developed by J. Welles Wilder and is an oscillator of momentum that measures price changes. It ranges from zero to 100 and works as a technical indicator in financial markets. RSI tells us that whether assets are oversold or overbought. To know this, we see RSI:
Range is 0 to 100
Overbought = RSI > 70
Oversold = RSI < 30
An asset is overbought if RSI is more than 70 and an asset is oversold if RSI is below 30.
Moreover, RSI tend to be in 40-90 range with 40-50 zone as support, in an upward or bull market while RSI tend to be in 10-60 range and 50-60 range acts as resistance during a trend-down or bear market. These ranges vary according to the RSI configuration and the strength of the underlying safety or market trend.
Formula to Calculate RSI
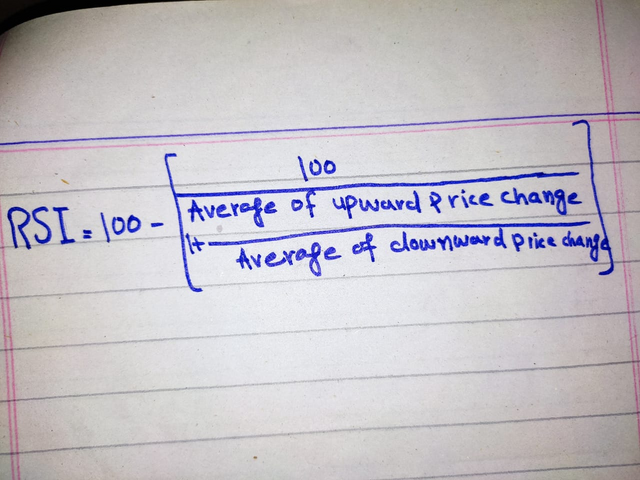
Here RSI = Relative Strength Index
Average of Upward Price Change = Average profit
Average of Downward Price Change = Average loss
For making my answer 𝑇𝑜𝑡𝑎𝑙 𝑠𝑢𝑚 𝑜𝑓 𝑎𝑙𝑙 more clear, I would tell you how to take average.

If we know the average price change that is either profit or loss, we just put it into RSI formula
and we can know whether assets are oversold or overbought.
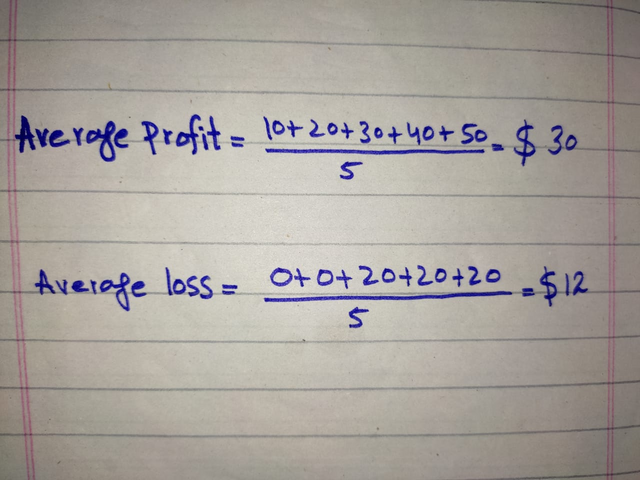
I will demonstrate it with an example:
5 days profit is: $10, $20, $30, $40, and $50
5 days loss is: $0, $0, $20, $20 and $20
Now average profit and loss according to above formula:
Now we just put this RSI formula:
 As we can see RSI is above 70, it indicates that assets are overbought. So the graph will go up
showing a bullish trend.
Q2: Can we trust the RSI on cryptocurrency trading and why?
As we know that crypto markets is very volatile and buying or selling assets at loss is terrifying
for everyone. So we need such indicators that can show us market flux and also give a technical
outlook of assets either overbought or oversold. In case of cryptocurrency, yes we can trust RSI.
It is because RSI is simpler and gives us smart way to know whether assets are cheaper or
expensive. Furthermore, if we use other indicators also to know market trends, we can get a
brighter look at market and our analysis before trade can be more precise and accurate
Q3: How do you configure the RSI Indicator on the chart and what does length parameter mean? Why is it equal to 14 by default? Can we change it? (Screen capture required)
I will use my Binance application to demonstrate configuration of RSI Indicator.
I open my Binance Application and click on Trades.
Here I can see market trend for BNB/BUSD.
Now I click on Technical indicators that I can see parallel to Time.
Here I select RSI.
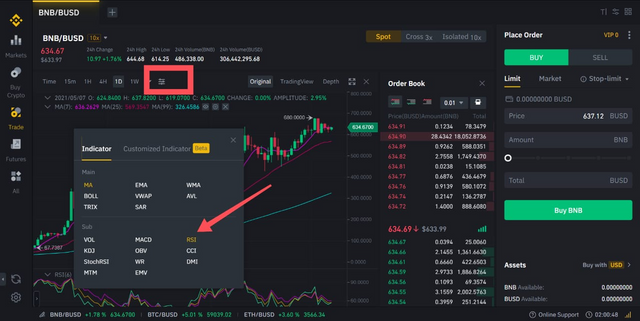
 Above trends can be seen by using RSI.
Length Parameter and its Configuration
The parameter of the time period (Length) determines the stability and volatility of the RSI and its reaction to changing conditions on the market. Most RSI are seen on 14 day length period because traders can cut losses here quickly and smaller gains can be achieved but experts claim that most appropriate length period is between 2-6. The magnitude of RSI is indicated as per the length period selected.
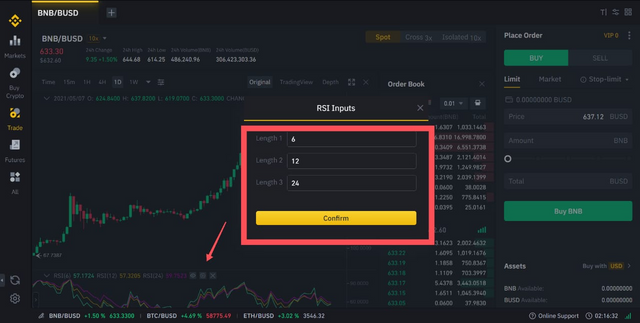
I use Binance to overview market trends and If I select 1 day time period, I can see 3 lengths; 6, 12 and 24 on Binance application.
I can show you how I have configured this and they are changeable as per traders consent.
I will select the settings icon parallel to RSI being shown below and here I can configure lengths.
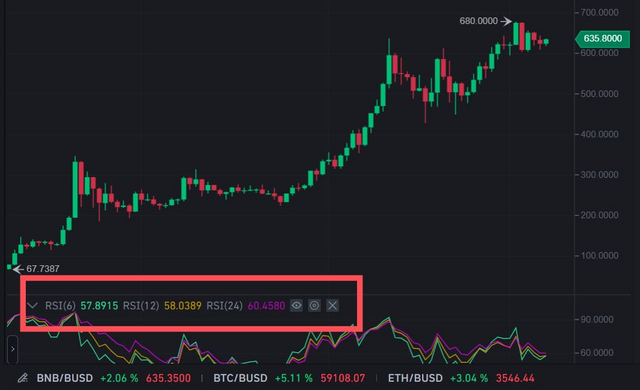
 Below you can RSI for 1 day time period.
 All screen taken from binance application.
Q4: How do you interpret overbought and oversold signals when trading cryptocurrencies? (Screen captured required)
As I have discussed above that if RSI is more than 70 and an asset is oversold if RSI is below 30.
I will show you by screen demonstration.
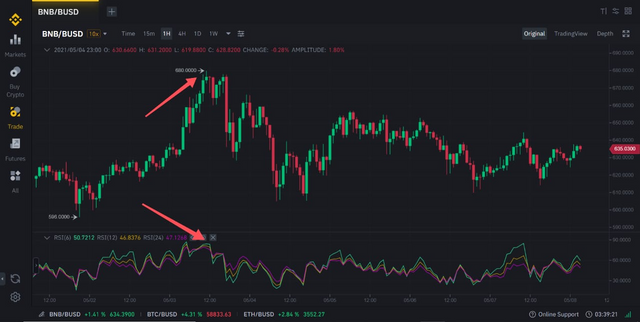
 Here above you can see that I have selected 05/05/2021 and 03/05/2021 and I can see the RSI values. On 03/05/2021, the RSI was below 30 (27.30), it means the assets were oversold and on 05/05/2021, the RSI was above 70 (85.26), it means the assets were overbought.
Q5: How do we filter RSI signals to distinguish and recognize true signals from false signals. (Screen capture required)
One of the simplest way to distinguish between true signals and false signals is that choose greater length periods because the shorter the time period, the more are fluctuating trends.
Another method to filter RSI signals is by overviewing divergence either bearish or bullish.
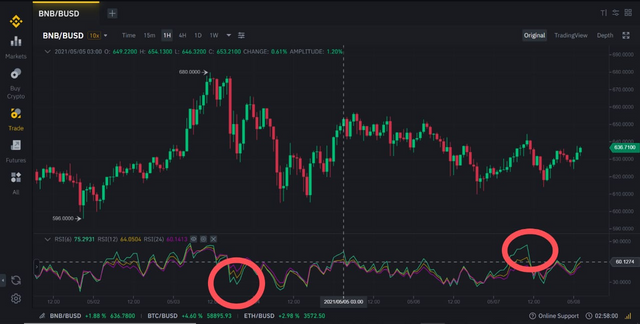
The pattern is bearish when the price rises to higher levels while the technical indicator doesn’t reach higher level and he pattern is bullish when prices falls to a low level while the technical indicator doesn’t reach low level. This is important to look for when we lock long positions or tighten our protective stops in profits. I will demonstrate both divergences below:
BEARISH DIVERGENCE:
BULLISH DIVERGENCE:
 We can filter also signals by reducing noise from the graph, it helps to show actual trends in market.
Q6: Review the chart from any pair (e.g. TRX/USD) and present the various signals from the RSI. (Screen capture required)
It is simple to interpret from RSI that I trade should either buy or sell. Now, when to buy and when to sell, I will demonstrate you from below picture
 As we can see from above picture that on 03/05/2021, RSI was 27. 30, it means below 30 and assets are oversold so we can buy here at lower price, and on 05/05/2021, RSI was 85.26, it means above 70 and assets are overbought so we can sell here at high price.
All screen taken from Binance
CONCLUSION
I have learnt a lot from RSI and understood that it more reliable than other indicators. From RSI, we can understand whether to buy or to sell. We can also check divergences either bearish or bullish. This can help us to be safe from loss during trade.
Cc:-
@kouba01
@yohan2on
Hello @noraiz,
Thank you for participating in the 4th Week Crypto Course in its second season and for your efforts to complete the suggested tasks, you deserve a 5/10 rating, according to the following scale:
My review :
Medium work, your answers were short and lacked an analytical dimension. Try to delve deeper into the points raised with more research and criticism.
Thanks again for your effort, and we look forward to reading your next work.
Sincerely,@kouba01
thank you sir..