Ultimate oscillator indicator- Steemit Crypto Academy- S5W8-Homework post for @utsavsaxena11
Hello,
This is a homework post for professor @utsavsaxena11.
.png)

Question : 1
What do you understand by ultimate oscillator indicator. How to calculate ultimate oscillator value for a particular candle or time frame. Give real example using chart pattern, show complete calculation with accurate result.
Answer :
Introduction
The ultimate oscillator is a technical indicator used for technical analysis of price charts of assets. It was first introduced by Larry Williams in 1976. The main motive of the developer for developing this tool is to measure the momentum of price in an asset across many timeframes.
This indicator, Ultimate oscillator uses weighted average of 3 timeframes to calculate its value and it is very less volatile. This indicator gives fewer trade signals when compared to other momentum-based indicators. This is because this indicator uses 3-time frames for its calculation and other indicators use only single timeframe.
Using this indicator we get buy/sell signals in case of divergences between the indicator and price of asset. And this ultimate oscillator indicator generates less divergence compared to other momentum indicator the reason for that is the use of multiple timeframes.
Calculations
- Oscillator indicator uses three timeframes for its calculation as we already discussed. This indicator uses three-time frames: 7, 14, 28 periods.
The shorter time frame that is 7 periods has the highest weightage in calculation for Oscillator indicator.
The larger time frame that is 28 periods has the lowest weightage in calculation for Oscillator indicator.
Formula:
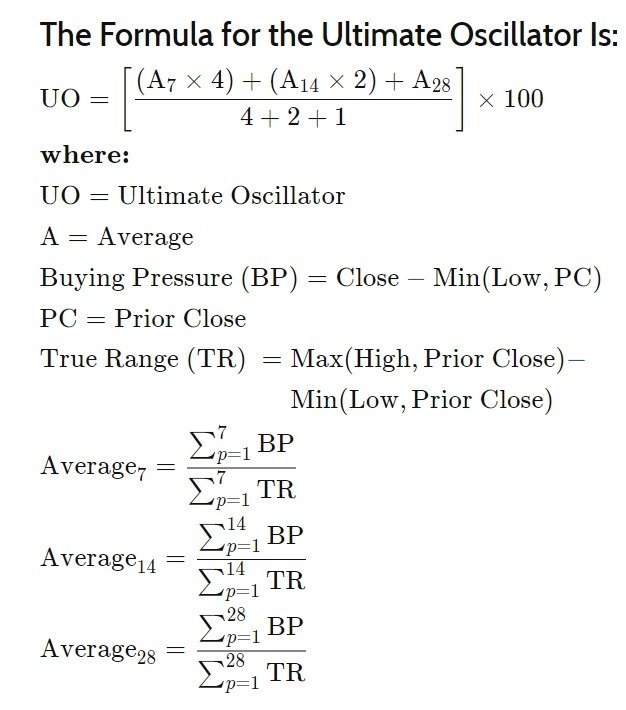
As you can see the formula for calculation of Oscillator Indicator. Let us take a quick look at the various steps involved :
1. For calculating the Buying Pressure(BP) we have to make the difference between the close of current period candle and minimum of the current low or previous close. In this way we calculate BP for all the periods which are later required for calculating the Buying Pressure Sum.
2. We now have to calculate the TR(True Range) which is the difference between the maximum among current high or previous close and minimum among current low or previous close. Similarly, we calculate their TR values for all the periods.
3. Now using BP and TR values for the different periods we can calculate the different averages.
4. As now we have all the values needed for the calculation of Oscillator indicator we will put all these values in the formula and calculate the value of our indicator.
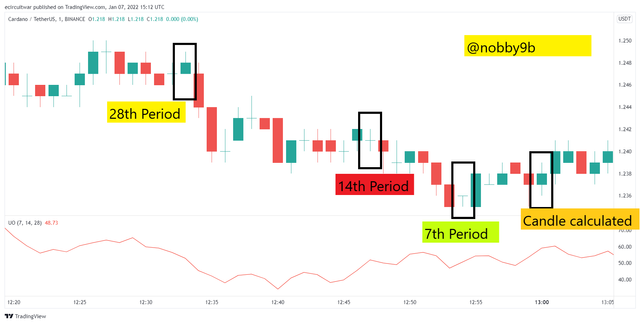
For example :
Here, I am going to do calculation for the Ultimate Oscillator for the following chart :
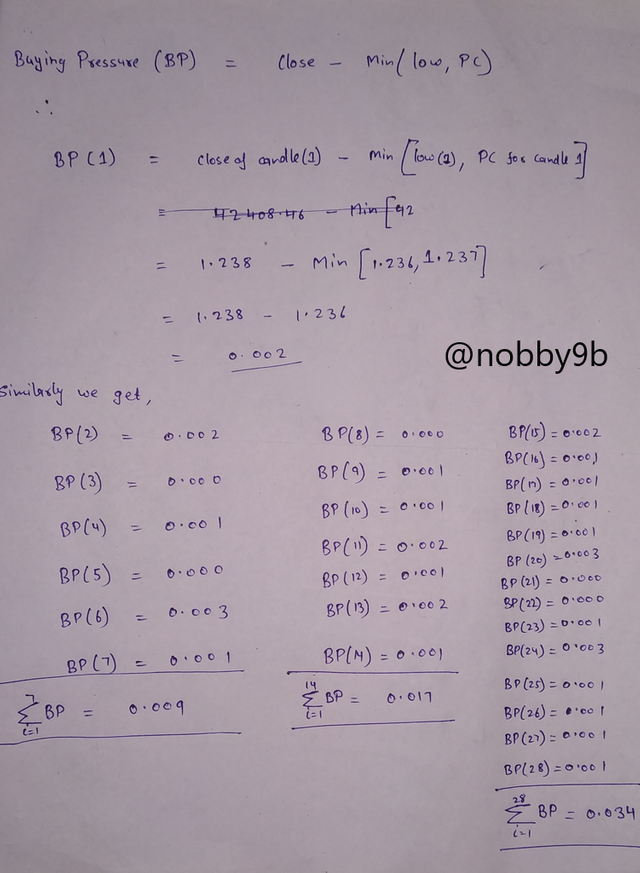
Now, we have to calculate all the values that are required in the formula for calculating the indicator. First, we find the Buying Pressure for all the 28 candles.
.png)
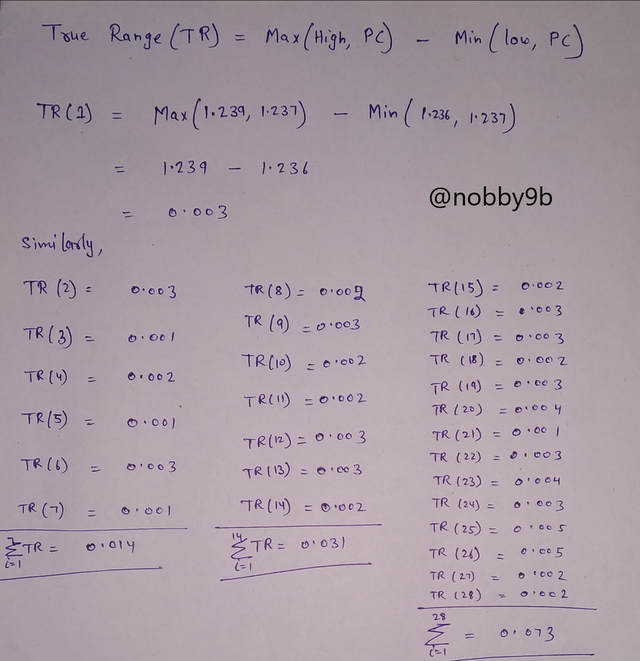
Now, as we find out the buying pressure, now we have to find out the true range value of all the candles.
.png)
Once we calculate all the value we put them in formula and calculate our value for Ultimate oscillator.
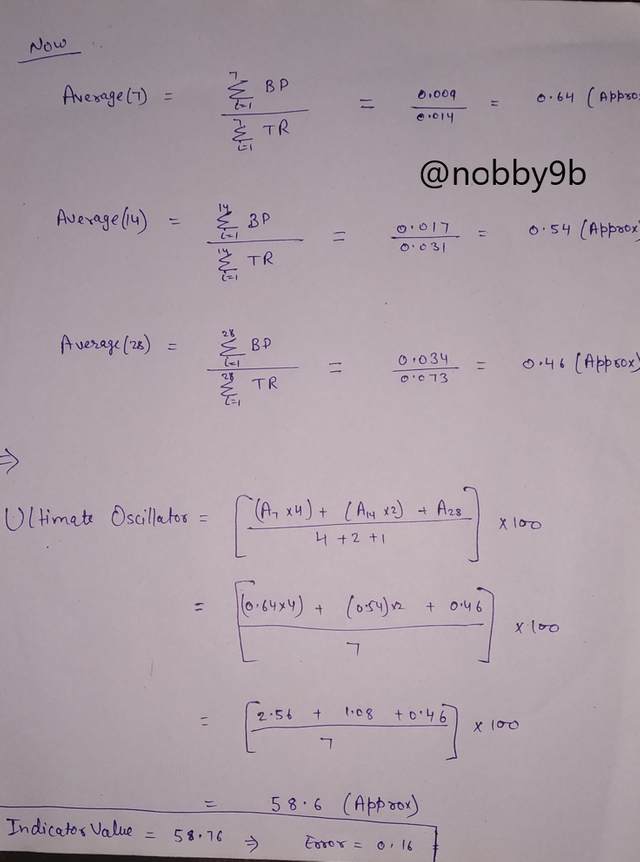.png)
As, you can see in the picture that our calculated value and the value calculated by he oscillator are approx. same just a difference of 0.16.
Question : 2
Answer :
Identifying Trends
There are basically two types of indicator as we all know. One is in downtrend and other is uptrend. Let us now look how to identify them using the Oscillator indicator.
Downtrend
A downtrend is started when the price of asset is in upward move and at the same time the Oscillator indicator touches the 70 levels that is overbought zone. This situation is clear indicaton that the prie of asset is starting an downtrend.
For example :
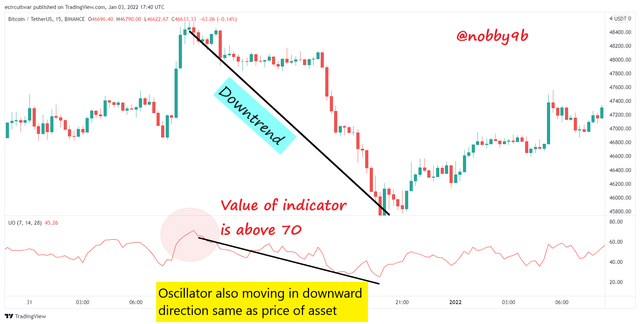
As you can see in the picture the price of asset is in upward move and the oscillator indicator touches the 70 level means it is an overbought zone now price of asset is expected to reverse and as you can see the downtrend started.
A strong downtrend is when both the price of asset and the oscillator indicator are going in same downward direction. As you can see that both these are in downward move so we can confirm the downtrend.
Uptrend
A uptrend is started when the price of asset is in downward move and at the same time the Oscillator indicator touches the 30 levels that is oversold zone. This situation is clear indicaton that the prie of asset is starting an uptrend.
For example :
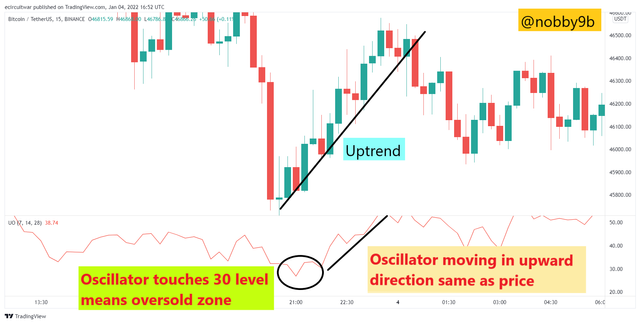
As you can see in the picture the price of asset is in downward move and the oscillator indicator touches the 30 level means it is an oversold zone now price of asset is expected to reverse and as you can see the uptrend started.
A strong uptrend is when both the price of asset and the oscillator indicator are going in same upward direction. As you can see that both these are in upward move so we can confirm the uptrend.
Ultimate Oscillator and Stochastic Oscillator
The first and main difference between the two is that Ultimate Oscillator indicator uses 3 time frames for calculation and the Stochastic Oscillator uses only 1 timeframe.
Another difference between two is that the Stochastic indicator does has a signal line but signal line needs to be added in ultimate oscillator indicator as ultimate oscillator does not have a signal line.
Question : 3
Answer :
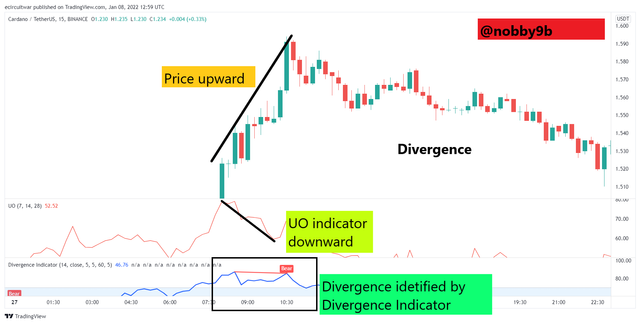
Before we start answer to this question let us first understand what a divergence is. So, divergence is situation that arises when the price of asset and the ultimate oscillator moves in opposite directions. For example-
Suppose the price of asset is moving in an upward direction but at the same time the ultimate oscillator line is moving in downward move this is know as divergence. Similarly, if the price of asset is moving in downward move and the ultimate oscillator indicator is moving in upward direction then tha indicates the divergence.
Divergence situations are very important to know if we are using the ultimate oscillator indicator as these divergence situations are the signals for the price reversal in price of asset.
Let us look at a real example of diveregence using ultimate oscillator indicator :
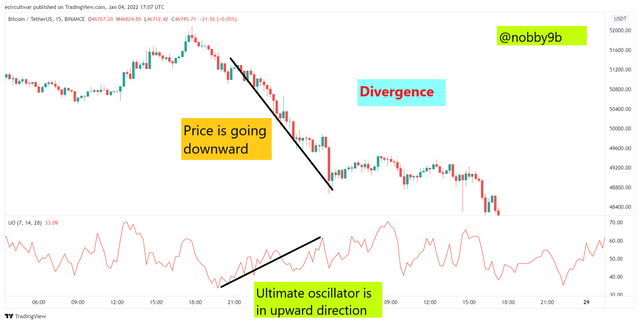
As you can see in the above chart I used the BTCUSDT chart. Here, as you can see that the price of asset in moving in an downward direction but at the same time the ultimate oscillator is moving in upward direction. As both are moving in opposite direction this is the situation of divergence.
Finding divergence is very easy, one can find divergence using the Ultimate oscillator easliy. I do not think that there is any need of any other indicator to find divergences. I found divergence with the help of Ultimate oscillator indicator easily as you only have to look for the situation when both are moving in the opposite direction.
If someone is finding it difficult to find the divergence using the Ultimate oscillator then we can use another indicators like A/D indicator (Accumulation/Distribution), Divergence indicator, RSI...etc, to find out divergences.
Example of Divergence using another Indicator :
Here, I used Divergence inicator to find out divergence. One can easily find out divergences using this indicator and this will also tell the type of divergence. Here, as we can confirm the divergence with ultimate oscillator also :
Question : 4
Answer :
Taking entry into trade using Ultimate Oscillator is simple as we only have to identify the divergence situations. Let us look at how to take entry using the Ultimate Oscillator.
Buy Side Trade
For buy side trade, we have to find out the divergence in which price is moving downward but the ultimate oscillator is moving upward.
Now we have to look at the value of the ultimate oscillator that must have atleast touched or crossed the 30 levels.
Finally we look at oscillator that must rise above divergence high.
Only all these conditions are satisfied by the price chart of asset we can take enrty into our trade.
Real example of trade :
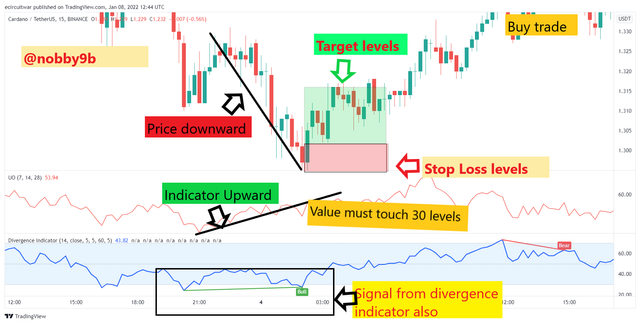
As you can see the chart clearly, all the conditions for taking entry into trade using the Ultimate Oscillator indicator are satisfie. So, it is good trade to make entry.
Let us now look at the Sell Side trade using the indicator.
Sell Side Trade
Similarly like buy side trade we have to find a situation where price is moving upwards and indicator is moving in downward direction.
Indicator must touch the 70 levels during this diveregence.
Value of indicator must fall below the divergence low.
Once all these conditions are satisfied we can make a good sell side trade using this Ultimate Oscillator Indicator.
Real example of a sell side trade :
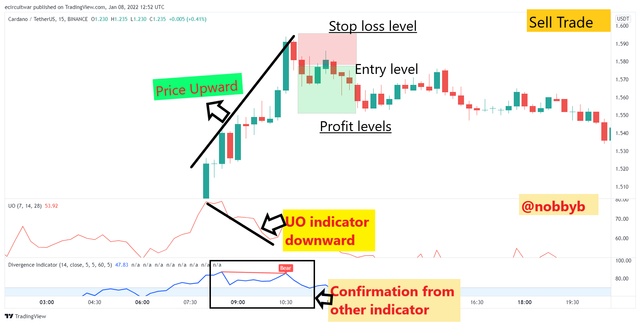
As you can see in the screen all the condition for a good sell side trades are fullfiled so we can make a good sell trade.
Question : 5
Answer :
Using Ultimate Oscillator in technical analysis is very useful because it is very easy to use and even a newcomer can understand it and make trades using this indicator.
If Ultimate indicator is used with another indicator than I think the success rate of this indicator will rise. I suggest you to use another indicator along with the Ultimate Oscillator to increase your sucess rate as we can not risk our money by just believing on single indicator.
We can use Divergence indicator to find out the diverences for the indicator easily and we use another indicator like MACD, RSI, Moving Average Cross along with Ultimate Oscillator to increase our sucess rate.
If we have to select the time frames in Ultimate Oscillator, I this this indicator best works at its default values (7,14,28 periods) and I suggest you to use the indicator at these values. When you use this indicator at these values it will provide signals for intraday trades as well as for long term trades.
This is a great lecture by professor @utsavsaxena11. In this article we learn about the Ultimate Oscillator and we also dicussed hoe this indicator is calculated. We try to finf out the calculation for indicator using the real values.
In later part, we have discuss about the steps for tradinf using the Ultimate Oscillator and we also look at the real examples of trade using this indicator. Trading with Ultimate Oscillator is easy as we have to find divergence.
However, the Ultimate Oscillator indcator is good but it is advised to use it with another indcators to increase its sucess rate.