Trading with Accumulation / Distribution (A/D) Indicator - Crypto Academy / S4W5 - Homework Post for @allbert
Hello,
This is a homework post for professor @allbert .
Question : 1
Explain in your own words what the A/D Indicator is and how and why it relates to volume. (Screenshots needed).
Answer :
A/D Indicator is also known as accumulation distribution line or accumulation distribution indicator (A/D). The accumulation/distribution indicator was developed by Marc Chaikin. The main purpose behind its creation is to determine the flow of money in any asset.
It is a volume-based indicator used to determine the trend of asset price , using the relation between asset's price and volume flow. Here, the accumulation means the level of buying an asset(demand) and distribution means the level of selling an asset(supply). Generally, accumulation is followed by an uptrend, and distribution is followed by downtrend.
Hence, A/D Indicator is based on the supply and demand pressure of asset, and one can predict the asset's future price trend using this supply/demand pressure. It also tells about the flow of money in asset either money flow inside or outside.
A/D Indicator seeks to find divergences between the asset price and the volume flow. This will provides insight about the strength of the trend. If the price of asset is rising but the indicator line is falling , then this indicates that buying or accumulation volume of asset is not enough to support the price rise of asset and a price decline in asset is forthcoming.
The main types of trends that are seen in A/D Indicator are
(1). In general, a rising A/D indicator line along with rising asset price helps to confirm a bullish trend(accumulation).
For example -
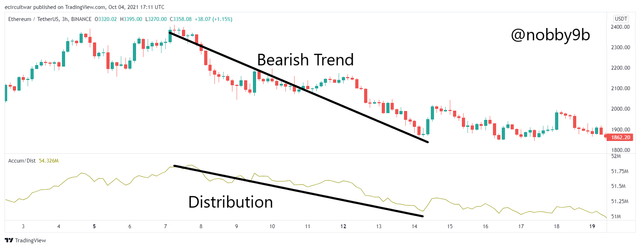
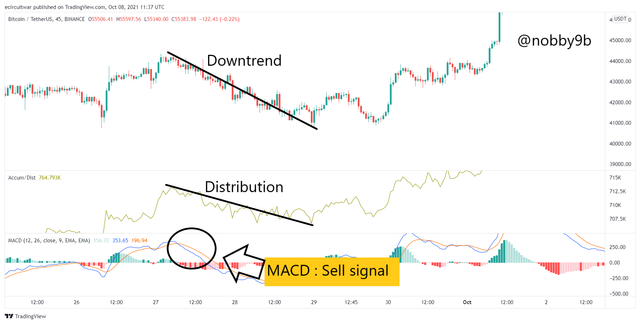
(2). A falling A/D indicator line along with falling asset price will help to confirm a bearish trend(distribution).
For example -
(3). A phase when A/D line and price both go in the opposite direction is also known as divergence.
For example -
To sum up , accumulation/distribution line is of use to traders who wants to measure buy or sell pressure on any asset or to confirm the strength of a trend.
This will tells about the volume force behind the price of asset.
Tells about the flow of money in asset either money flow inside or outside.
This will also spot the divergences which tells about new price trends.
It is easy to use.
Tells about buying/selling pressure on any asset, based on that one can find possible price change in asset's price.
It is also used to confirm the strength of trend, longevity of current trend.
This indicator does not tell about changes in price between periods , because of this many price gaps may not be detected.
All the signals are not 100% accurate.
It sometimes does not give signals for small price changes.
You can not use this indicator in all types of trading styles.
The Accumulation/Distribution Indicator is based on volume and price of asset. It is a cumulative measure of each period's volume, money flow. The value of Accumulation/Distribution indicator is directly proportional to the volume flow in asset. This direct relation can be interpreted by formula of calculating A/D line. The calculation of different formula is discussed in later part of this article. For now we directly look at the formulas :
(1.) - Money Flow Multiplier = [(Close - Low) - (High - Close)] /(High - Low)
(2.) - Money Flow Volume = Money Flow Multiplier x Volume for the Period
(3.) - A/D = Previous A/D + Current Period's Money Flow Volume
So, these are main formulas used in calculating A/D value. Here, as you can see in formula 2 the volume is directly proportional to money flow volume which is proportional to A/D value in formula 3. This means that, if volume increases then money flow volume increases and if money flow volume increases the A/D value increases and similar thing happens when volume decrease.
The higher value of positive multiplier combined with the higher volume tells about the strong buying pressure and this will pushes the value of indicator higher. Similarly, the negative multiplier value is combined with high volume tells about strong selling pressure that pushes the value of indicator lower.
Question : 2
Through some platforms, show the process of how to place the A/D Indicator (Screenshots needed).
Answer :
To add A/D Indicator to your charts follow these steps :
(1).Go to trading view websiteLink and open any chart. And click on Fx option to add any indicator.
(2). Search for accumulation/distribution in search box and your result comes up.
(3). Now, click on accumulation/distribution indicator and your indicator is applied on your chart. Indicator can be seen in the bottom part of chart.
In this way, by following these steps you can add A/D Indicator to any chart easily.
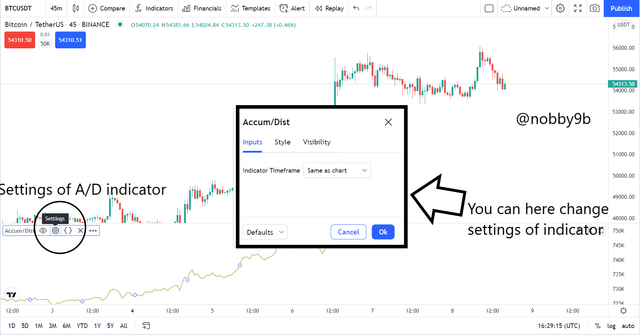
You can also change settings of indicator as you want after clicking on settings option. This indicator does not have much of settings to change but has only setting as time frame, you can change the color of line and other things in settings option.
Question : 3
Explain through an example the formula of the A/D Indicator. (Originality will be taken into account).
Answer :
A/D Indicator's formula comprises of three components. These three factors are important for calculating A/D Line. First of all, we need to calculate Money Flow Multiplier. Formula for calculating this is :
(1.) - Money Flow Multiplier = [(Close - Low) - (High - Close)] /(High - Low)
Here,
Close means closing price for that period.
Low means low price for that period.
High means higher price for that period.
(2.) - Now the second component we need to find is Money Flow Volume and formula for that is :
[Money Flow Volume = Money Flow Multiplier x Volume for the Period]
The formula for this is very simple to understand, we just need to multiply volume of period with money flow multiplier(we did calculation for that above) to get Money Flow Volume.
(3.) - Now, we will find A/D line using these two factors. Formula we use here is :
[A/D Line = Previous A/D + Current Period's Money Flow Volume]
It is also very easily understood that we sum up value of current money flow volume with previous A/D value to get A/D Line. A/D value is calculated by adding the previous A/D value to current period's money flow volume, that means the money flow volume is the first A/D value.
In this way we do calculations for Accumulation Distribution Line.
Note -
The money flow multiplier lie in range between +1 to -1. If the asset's closing price is in upper half of high-low, then the money flow multiplier has positive value and if asset's closing price is in lower half of high-low, then the money flow multiplier has negative value. The multiplier has value +1 when closing price is on high and it has value -1 when closing price is on low.
The value of money flow multiplier tells about the buying and selling pressure on asset. The positive value of multiplier indicates that buying pressure is strong than selling and a negative value of multiplier indicates that selling pressure is strong than buying pressure in asset.
For example :
Here, I tried to explain the formula with the help of practical examples. Below you can see the details :
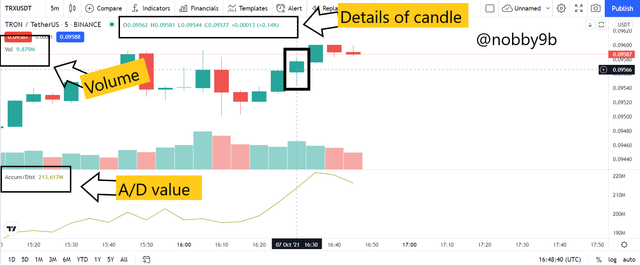
Here, I am talking about the candle in rectangle. The high price, low price, close price details can be seen in top part of picture. The details are :
Open price of candle = $ 0.09562
High price of candle = $ 0.09581
Low price of candle = $ 0.09544
Close price of candle = $ 0.09577
You can also see the A/D value for the candle, and volume traded, both these details are highlighted in the picture.
A/D value = 213.617M
Volume = 9.879M
Now, as we know all the details required to calculate A/D value for the new candle, we now put these values in formula and calculate.
Calculations :
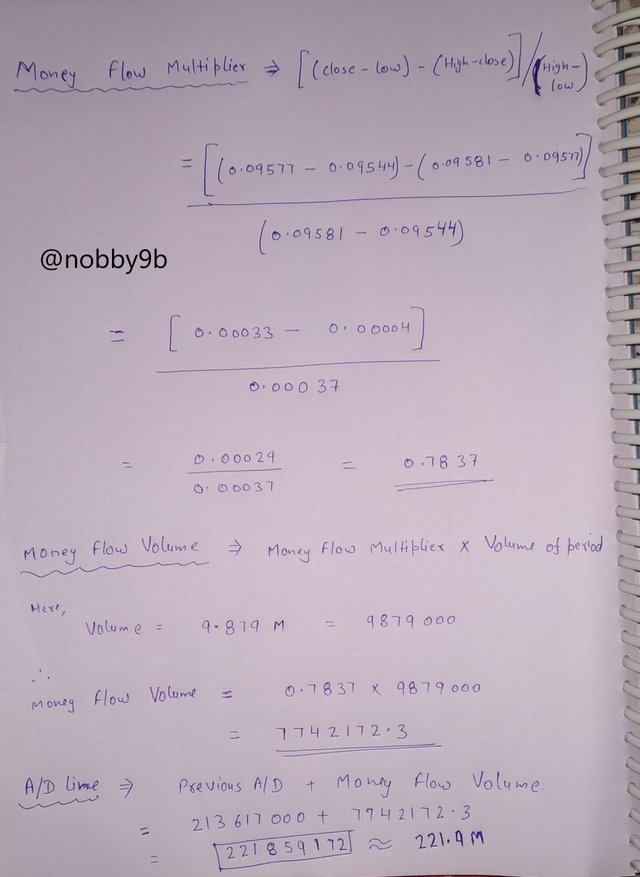
Formula that we used and the value that we get from the calculation are :
(1.) - Money Flow Multiplier = [(Close - Low) - (High - Close)] /(High - Low) = 0.7837
(2.) - Money Flow Volume = Money Flow Multiplier x Volume for the Period = 7742172
(3.) - A/D = Previous A/D + Current Period's Money Flow Volume = 221859172
So, we get the value of A/D after calculation as 221859172 which is approx 221.85M(which I written as 221.9M in picture) and the value calculated by trading view is approx same which is 221.82M. The value calculated by trading view can be seen below :
As you can see the details, the A/D value by trading view is 221.82M and this is approx to that we calculated as 221.85M
Question : 4
How is it possible to detect and confirm a trend through the A/D indicator? (Screenshots needed).
Answer :
As we all know that A/D indicator is based on volume and price of asset. The basic rule on which this indicator works is that asset volume precedes asset price means the volume flow in the asset will helps to determine the future price trend of asset.
Trend confirmation is very simple and straight forward concept. One can easily find trends using A/D indicator, as we already discussed that this indicator is based on price and volume of asset that's why most of the time price trend and the A/D line goes in same direction.
Uptrend/Bullish Trend
We confirm an uptrend using this indicator, when the price of asset in moving up and A/D indicator line is also moving up along with the price. This indicates that the money is coming inside the asset making price of asset go higher.
For example -
As you can see in the picture both price and A/D line are in uptrend so, this will confirm the bullish trend.
Downtrend/Bearish Trend
This is confirmed when the price of asset is in Bearish Trend and the A/D indicator line is also moving down. This indicate that money is leaving the asset and people are distributing the asset making its price go in downward direction.
For example -
As you can see in the picture both price and A/D line are moving downwards so, this will confirm the bearish trend.
Divergence
This situation arises when the A/D line and price of asset moves in opposite direction. There are mainly two types of divergence : positive divergence and negative divergence.
When the asset price rises while A/D falls then this indicates that the uptrend is likely to stop. This is known as negative divergence.
When the asset's price continues to fall but A/D rises then this indicates that the downtrend is likely to stop. This is known as positive divergence.
A practical example of divergence is :
As you can see in picture that price of asset is falling but the A/D line is rising to make it a positive divergence.
Question : 5
Through a DEMO account, perform one trading operation (BUY or SELL) using the A/D Indicator only. (Screenshots needed).
Answer :
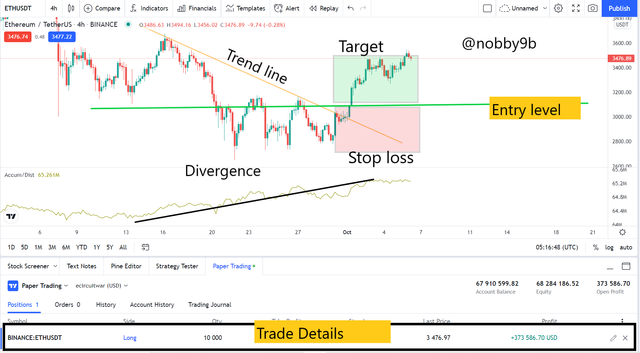
We here use A/D Indicators divergence structure for making trades. As we already discussed that a divergence occurs when indicator and price of asset moves in opposite direction. These divergences are very good indicators for trend exhaustion and also tells about starting of new trend. So, by help of these divergences we will make our trades.
To make a buy trade entry, we follow these steps :
(1). For a buy side trade we first need to find a positive divergence where the price of asset is in downtrend and indicator is moving up, this situation gives a clear indication that this bearish trend is about to end and a new trend will start.
(2). Now we draw a trend line by joining the lower highs. In this case the trend line should be a downward slope line.
(3). We will wait for the breakout of this trend line to make a trade entry.
(4). Once the price of asset breaks this trend line we make our buy trade entry at the close of the candle.
Exit from any trade is taken in one of two directions, one is when trade is going in your desired direction and another one is when trade is going opposite to your desired direction.
When trade is going in your desired direction then you can exit from your trade taking profit in 1:1, 1:2,....etc. risk-reward ratio.
When trade is going against you then you exit your trade by putting stop-loss levels at slightly below/above the trends lowest/highest point respectively.
For example -
The practical knowledge is far more important than only theory knowledge. So, I will try to make my point using a real example :
This is picture after approx 20hours I initiated trade.
As you can see in the picture, these are trade details that I made using A/D Indicator.
In my trade, I first draw a trend line by joining the lower highs in price trend and I get a downtrend line. After that I see the A/D line which is in uptrend , this is the situation for a divergence. So, wait for some time and once the trend line breaks I made my entry at the closing level of candle. I put my stop loss levels as below the lower point of trend. and put target price in ratio 1:1 with stop loss. My target is almost achieved as you can see in the picture, so I exit from my position, in this trade I make good profit but it is a demo trade🤣🤣.
Question : 6
What other indicator can be used in conjunction with the A/D Indicator. Justify, explain and test. (Screenshots needed).
Answer :
In all kinds of markets, it is always good to use more than 1 indicator. It is good to take decisions based on more than 1 indicator, as you can not put your everything based on only 1 indicator's signal. So, here I use MACD indicator along with A/D indicator for better success rate in trades.
I just give a brief introduction about MACD, it is Moving Average Divergence Convergence indicator. MACD is a trend-following momentum based indicator. It shows relation between the two moving averages of asset's price. These two lines are known as signal line and MACD line. When MACD line crosses above its signal line, then it is a signal for buy side trade. When MACD line crosses below signal line, then it signals for a sell side trade.
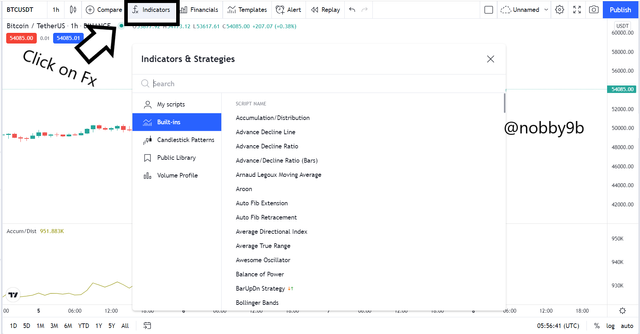
(1). First you go to any chart on trading view.Trading View Now click on the Fx option.
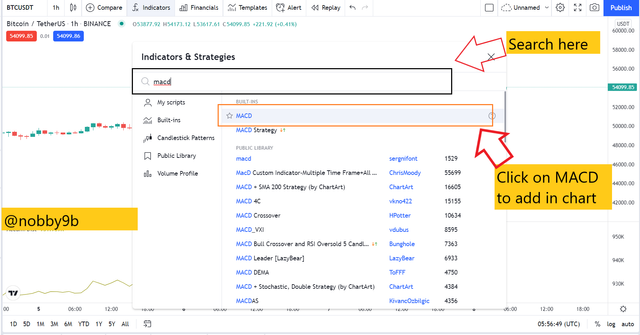
(2). Now you need to search for MACD in the search box and click on MACD to add indicator in your chart.
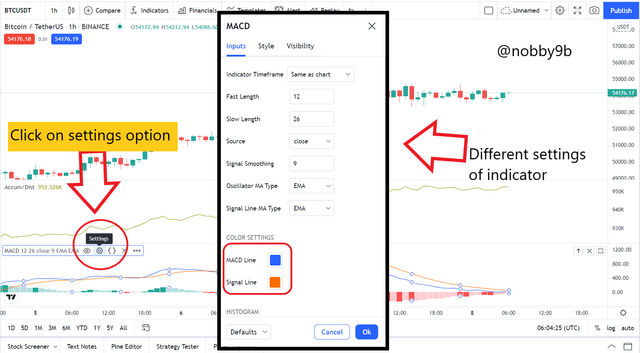
(3). Your MACD indicator is successfully added to your chart, you can also change setting for your indicator after click on settings option of indicator.
You can see different inputs for your indicator that you can change according to your trading. Here, blue line indicates MACD line and orange line is signal line.
Getting signals from more than 1 indicator is always good for traders. I here show you how MACD along with A/D indicator gives strong signals. I used both these indicators and see the results below :
Using both the indicators, as you can see we get strong buy signal. Here, you can see that A/D indicator is in accumulation phase(uptrend) this indicates that money is coming inside the asset and its price will rise soon. At the same time the MACD indicator also shows the buy signal as MACD line crosses signal line in upward move. And, as you can see price of asset starts a new uptrend. So, in this way we use MACD with A/D indicator to find strong buy signals.
Here, you can see that A/D indicator is in distribution phase(downtrend) this indicates that money is going out from the asset. At the same time the MACD indicator also shows the sell signal as MACD line crosses signal line in downward move. And, as you can see price of asset starts a new downtrend. So, in this way we use MACD with A/D indicator to find strong sell signals.
For testing both the indicators, I first put them on chart. Ans wait for a strong trade entry point. Here, below you can see the Trade setup of my trade and Actual trade details
Screen just before the clear signal by MACD.
As you can see in the picture that the price of asset is in downtrend and the A/D line is in uptrend. So, this is a clear sign of divergence means this trend is going to end. Now I draw a trend line on chart and wait for a clear breakout of that trend line. Once the price breaks the trend line, I need to enter into trade at the closing price of candle if I am trading using A/D Indicator only.
But here, I am also using MACD indicator which did not give a clear buy signal yet. So, I wait for some time and once MACD gives proper signal for buy trade, I initiated my trade. Note that the screen is captured just before MACD gives clear signal for buy trade, I forgot to take screenshot at the time of clear signal but you can see the clear signal in the picture below.
This is the proper trade setup of my trade. You can see in the picture the trade details in the bottom of picture.
Here, I first draw a trend line which is in opposite direction to A/D line this is indicating a clear divergence. The price trend need to reverse once it breaks the trend line and when price breaks the trend line , I wait for MACD indicator's signal for buy trade and I took entry after that at the second candle.
In this trade, I put stop loss level at slightly below the lower price of trend. I put target level in ratio 1:2 with stop loss level. Target levels are put according to trader, one might be aggressive trader and one might be a cautious trader. But one should trade with at least 1:1 risk-reward ratio.
Conclusion
In this article, we learn about the A/D Indicator. This indicator's working is based on both price of asset as well as volume. We also learn that volume is directly related to A/D value and if volume increases/decreases the value of A/D increases/decreases respectively. We also learn about how to calculate of formula for A/D indicator.
We learn about different trend using A/D indicator. When A/D line and price of asset both go in upward/downward direction this indicates that money is coming in/going out from asset respectively. If A/D line and price of asset moves in opposite direction then this show the condition of divergence means the current trend in price of asset is going to end soon. In the end, we also learn how to place actual trades using the A/D indicator and also look at its working when it is combined with other indicators.
That's all from my side. I hope you like and learn something from my article.
.png)


.png)


.png)




You have been upvoted by @sapwood, a Country Representative from INDIA. We are voting with the Steemit Community Curator @steemcurator07 account to support the newcomers coming into Steemit.
Engagement is essential to foster a sense of community. Therefore we would request our members to visit each other's post and make insightful comments.
Thank you.