Introduction to the Principles of Crypto Analysis - Crypto Academy S4W7 - Homework Post for @imagen
Hello,
This is a homework post for professor @imagen
.png)

Question : 1
What are the differences between Fundamental Analysis and Technical Analysis? Which one is used most often?
Answer :
Fundamental Analysis
In cryptocurrency markets, fundamental analysis is done in the same approach that is used in any other market.
Fundamental analysis is an approach used by traders/investors to find out the intrinsic value of asset. This is done by looking at all the external and internal factors, their main goal is to determine whether the asset is undervalued or overvalued. They can now analyze that information and then take entry or exit positions in asset.
Traditional fundamental analysts usually look to business metrics to figure out what is the real value of that asset or business. The main goal of this analysis is to find out the expected price of asset in future compared to the current price. If the expected value is more than the current value, the asset is said to be undervalued. And if the expected value is less when compared to current value, the asset is said to be overvalued. Based on all this analysis of asset you can decide whether you want to buy it or not.
There are many benefits of doing fundamental analysis of asset. Some of them are :
Fundamental analysis helps to mitigate the risks of scams. It will tells about project whether it is a good project or a fake project.
It helps to find the undervalued asset and also tells about the future of asset. Both these help investors to put their money in good asset.
When we use fundamental analysis with technical analysis it will increase our success rate.
Some of the disadvantages of the fundamental analysis are :
As fundamental analysis use all external and internal data, so sometimes a fake news can affect an asset's price.
Fundamental analysis is a process that requires a large amount of time.
You may need to hold the asset for a long time period.
Do not provide proper entry and exit levels for asset like technical analysis provide.
It is not sure that the investor has identified a correct undervalued asset, sometimes the undervalued asset keeps performing poorly for a long period of time.
Fundamental analysis is done using many variables. We do fundamental analysis in mainly three categories: Project Analysis, Metric Analysis, Onchain Analysis.
Project Analysis
This analysis looks at the performance of team, the whitepaper, upcoming roadmaps.
The Whitepaper
Before investing, it is always recommended to read the whitepaper of the project. Whitepaper is a technical document that gives an overview of a crypto project. A whitepaper will define the goals of the network and gives answers to questions like :
The roadmap for new features
Technology used
Supply and distribution scheme of asset
The team
It is good to know about the people behind the project, are they have the required skills, qualifications. Has the team undertaken successful ventures in this industry before ?, Do they have the expertise required to take the project to milestones?
Competition
Once you identify the sector to which the project belongs, you can also locate similar projects and competitors. You can find out the advantages it offers in relation to rest of competitors like greater speed, lower fees,...and many more.
Financial Analysis
Information about how asset currently trades, at what levels it traded previously, liquidity,...etc. All these information are very useful in fundamental analysis. Some other metrics that falls under this category are :
Market Capitalization
Market capitalization of asset is calculated when circulating supply is multiplied with the current price of asset. Generally, a project with lower market capitalization has greater growth potential, and project with higher market capitalization has lower growth potential. Higher market capitalization assets are helpful in providing stability to market.
Liquidity
This tells about, how much liquid is the asset? This means how easily we can make trades using the asset. Higher liquidity of asset means higher volume traded in asset and similarly, the lower liquid asset has lower volume traded. Larger market capitalization assets like BTC, ETH has higher liquidity when compared to low market capitalization assets.
Circulating Supply
This tells about how many tokens of cryptocurrency are in circulation at the current time. This value may change from time to time depending on the volume and demand for asset.
Total Supply
It is the total number of coins that exists at the current time minus the burned/withdrawn coins.
On-Chain Analysis
This analysis allows you to analyze a cryptocurrency asset through all activities carried out on blockchain. In other words, on-chain metrics are those that can be observed by looking at the data which is provided by the blockchain network. The on-chain metric includes some analysis like :
Transaction Count
Transaction value
Active addresses
Hash rate
Volume staked,...and many more.
Some models also like Stock-to-Flow model uses ratios, which allows you to predict the value of cryptocurrency assets with respect to their current price. Higher the ratio means higher scarcity due to which higher is the value of asset.
So, these are some of the metrics that we use for the fundamental analysis of any crypto asset.
Technical Analysis
Technical analysis is examining and predicting the price movement of asset in markets, by using previous price charts and market statistics. This analysis is based on the idea that if an investor/trader is able to identify previous market patterns, he can make a fairly accurate price prediction for the asset.
Technical analysis is one of the two market analysis, other one is fundamental analysis. Whereas fundamental analysis depends on asset's true value with the meaning of internal and external factors, the technical analysis depends purely on the price charts of asset. It is just identification of patterns on price chart and predicting its future price.
Technical analysis is usually used to generate short-term trading signals. These signals are generated by the help of various charting tools and indicators. Nowadays as we all know technical analysis has evolved to includes hundreds of indicators and hundreds of patterns.
Some of the types of indicators that are used in technical analysis are :
Price trend-based
Volume-based
Momentum based
Oscillators,....and many more.
Technical analysis also includes a hundred types of patterns. Two main kinds of patterns are :
1.Continuity Patterns : These patterns indicate a temporary break in an existing trend. These patterns are pauses in the prevailing trends. These patterns can be found in both uptrends and downtrends.
2.Reversal Patterns These patterns shows a change in an existing trend. A new trend is expected to start after these patterns. Some of the examples of these patterns are : Head and Shoulder pattern, Double Ceiling,....etc. You can search on internet to get more informations about these patterns.
Difference between technical analysis and fundamental anaylsis
Following are the difference between the technical and fundamental analysis :
| Fundamental Analysis | Technical Analysis |
|---|---|
| It is the practice of analyzing any asset to determine its intrinsic value. | It is a method for determining the asset's future price using asset's price chart. |
| Fundamental Analysis is suitable for long-term investments. | Technical analysis is suitable for short-term investments. |
| Fundamental Analysis is used for investing purposes. | Technical analysis is used for trading purposes. |
| Fundamental analysis is done to identify the intrinsic value of asset. | Technical analysis is done to identify the right entry/exit point in market. |
| In fundamental analysis, decisions are based on information available. | In technical analysis decisions are based on market trends and price of asset. |
| Fundamental Analysis mainly focuses on past and present data of asset. | Technical analysis mainly focuses on past price data of asset. |
Which one is used most often?
The debate over technical analysis and fundamental analysis is controversial. Basically, fundamental analysis is most useful for long time investments, whereas technical analysis is most useful for small time trading. Both fundamental analysis and technical analysis are combined together to execute investments for medium to long time frames.
Short term movement of price are mainly determined by demand and supply, which are in turn affected by a lot more than what we typically analyze in fundamental analysis. Market sentiments and effect of emotions on market can only be analyzed by using volume and price data of asset. On the other hand, price chart of asset can not be used to determine whether the asset is overvalued or undervalued. Price charts of asset only reflects what happened in the past and the overall price data of asset.
So, I think technical analysis is often used in markets these days. As fundamental analysis requires more time to analyze and it is used for long time investments. People prefer to use technical analysis because it requires less time to analyze and provides very good predictions for the future price of asset. One can use technical analysis for short-term investing by analyzing short time frame charts and one can also use technical analysis for long-term investing by analyzing long time frame charts.
Question : 2
Choose one of the following crypto assets and perform a Fundamental Analysis indicating the objective of the Project, Financial Metrics and On-Chain Metrics.
- Cardano (ADA)
- Solana (SOL)
- Terra (MOON)
- Chiliz (CHZ)
- Polkadot (DOT)
Answer :
In this question, I choose Cardano (ADA) asset for doing its fundamental analysis.

Fundamental analysis of Cardano (ADA)
Cardano(ADA) is a blockchain platform which is developed by Charles Hoskinson(co-founder of Ethereum) in 2017. It serves as an alternative to Ethereum and Bitcoin because it reduces the limitations of Ethereum and Bitcoin blockchain.
Cardano(ADA) provides better scalability, less fees for transactions and faster speed compared to Bitcoin and Ethereum blockchains.
ADA is the native currency for the blockchain Cardano. The name ADA was after a mathematician or first computer programmer.
Why to invest in ADA?
In the cryptocurrency world, there are hundreds of assets , one gets a lot of options to choose from and then invests in it. So, why does anyone wants to invest in ADA. To answer this question, I here do a fundamental analysis of ADA.
The fundamental analysis and my reasons for choosing Cardano blockchain are :
(1). Consensus Algorithm
The algorithm is the first thing that one should check in blockchain, as this algorithm is used for generating new blocks and to validate transactions on blockchain network.
ADA(Cardano) uses proof of stake consensus protocol and the same is used in Ethereum blockchain. Proof of stake consensus protocol will help to minimize the energy consumption involved in the formation of new blocks. This is done by eliminating the use of ASIC miners of hash power( this hash power is used by computers to operate and solve algorithms to claim a block).
Now the question comes that, if proof of stake consensus protocol is already part of Ethereum blockchain so how Cardano blockchain is more energy-efficient than Ethereum blockchain.
Ouroboros
Ouroboros is the main algorithm that is used by Cardano blockchain, there are a lot of slots of fixed periods and these slots consist of epochs. As of now, an epoch has a lasting period of 5 days and a slot lasts for 1 second. The period mentioned here is not fixed but it can be changed according to the number of different users working on the blockchain.
Same as proof of elapsed time consensus, Ouroboros too have a lottery system but the difference is that you must have to stake your holdings to take part in mining process and you have a greater chance of claiming a block if you had a greater number of stakes holdings.
This ouroboros has two methods to reduce energy consumed during the mining process. These are :
(1). By reducing the number of holders who are required to remain online for mining a block.
(2). By using a concept called stake pools, in which holders select some of them to participate in mining while others remain offline at the same time to save energy consumption.
Due to less energy is consumed, the transaction fees are low in Cardano and this is one of the many reasons for selecting Cardano blockchain(ADA).
(2). Listed on Exchanges :
Another thing that investors must look at is liquidity. If the asset has higher liquidity that means it is easily tradeable with other assets.
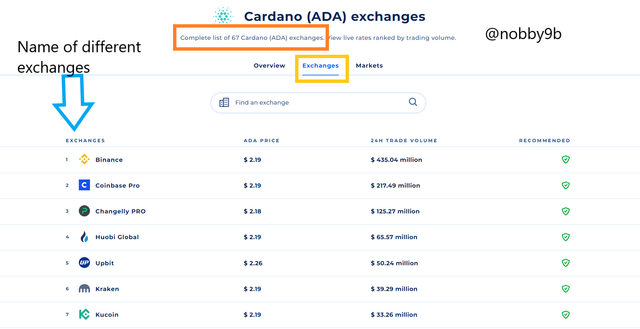
It is very important to look for listings of asset you are selecting means on how many exchanges your selected asset is listed. When I searched this for Cardano(ADA), I found that it is listed on 67 exchanges. Listed on that many exchanges means it is a good quality asset.
List of different exchanges that has ADA listed :
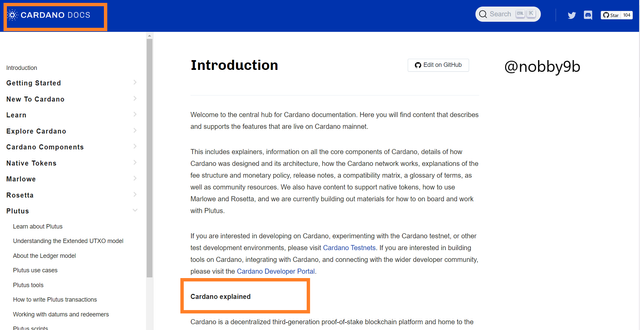
(3). Whitepaper of Cardano
This is another important thing that investors should look at before investing. The whitepaper contains all the details about features and services that are provided by the platform.
We get to know about the open-source and decentralized nature of Cardano(ADA) blockchain from its whitepaper. Its whitepaper also tells about the algorithm used(Proof-of-stake/Ouroboros).
Whitepaper has details about the team behind the creation of Cardano and who are still working on the project.
According to the whitepaper of Cardano the main features provided by the Cardano are : Sustainability, Scalability, Security and Transparency.
To ensure the security of its users Cardano(ADA) has used HASKELL language to program its functions. The whitepaper also mentions about the integration of smart contracts that will lead to the creation of several Dapps on Cardano.
The last part of whitepaper of Cardano focuses on giving rights to its holders/stakers for voting. By giving this right, users will be able to influence the future developments of the Cardano blockchain. This also helps Cardano blockchain to make it more decentralized than other blockchains.
Note -
All the details mentioned above are taken from Cardano website Source :
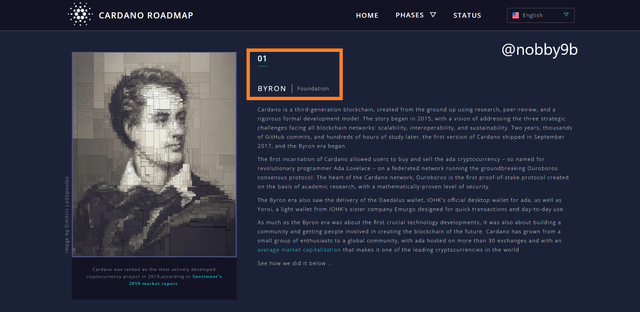
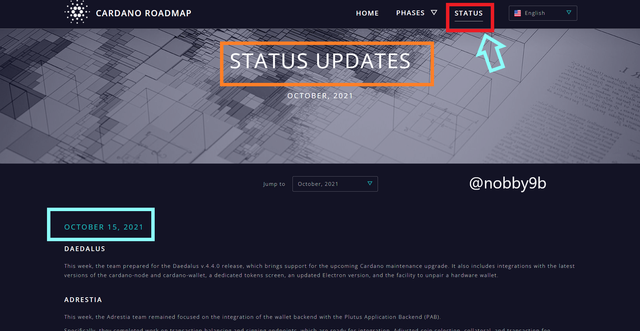
(4). Roadmap of Cardano
A roadmap of crypto project tells about its past development and also tells about its future goals.
In the roadmap of Cardano(ADA) blockchain, there are 5 eras of Cardano, each era tells about the development that happened in that era.
These 5 eras of Cardano blockchain are :
(A). Byron : This era of Cardano tells about the starting of Cardano blockchain as a third-generation blockchain. This era also tells about the Ouroboros algorithm which is 1st proof-of-stake protocol based on research and has proved to be secure algorithm. It also tells about the different wallets that were launched for fast transaction of ADA coin, these wallets are Yoroi and Daedalus wallet. Further, it tells about the number of exchanges on which ADA is listed.
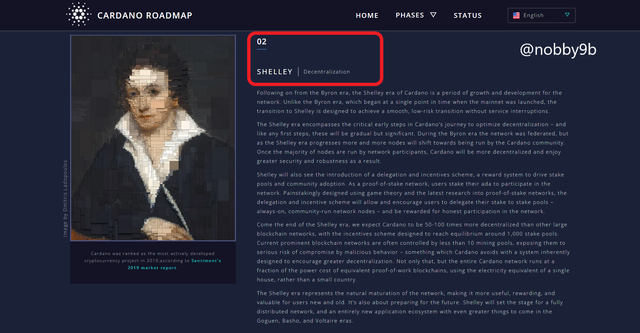
(B). Shelley : It focuses on decentralised nature of Cardano(ADA) blockchain. In this era cardano aims to add its user in mining process which was earlier controlled by Cardano, this will help more users to take part in mining process and run a node, all this will lead to a decentralized platform. This era has details of delegation, staking pool, mining pool, in return liquidity providers will get rewards.
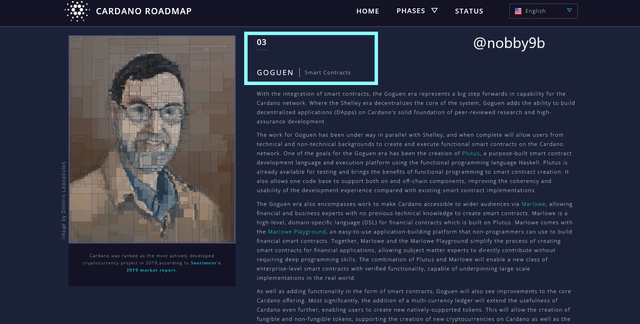
(C). Goguen : This era has details about the introduction of smart contracts in Cardano blockchain that will permit users to make Dapps on Cardano. It is a very good development by Cardano because the Ethereum blockchain charges high fees for smart contract transfers.
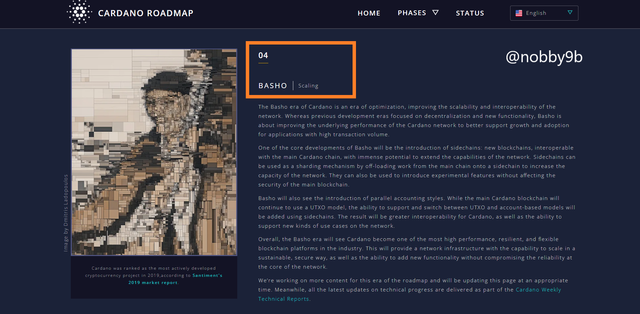
(D). Basho : This era of Cardano blockchain focuses on providing greater scalability to blockchain by introducing forks or sidechains. The main work of these forks on sidechains is to reduce the load from the main blockchain.
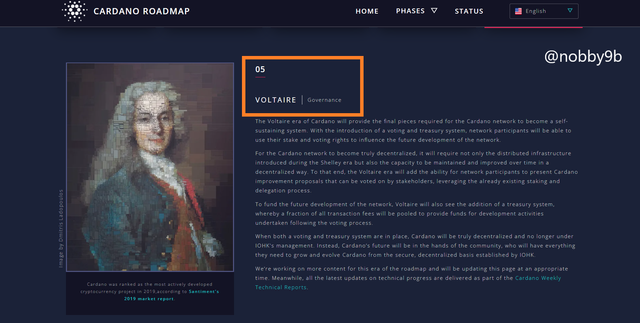
(E).Voltaire : This era of Cardano blockchain tells about the governance of Cardano. During this era blockchain provides voting rights to its users.
There is an option of status on the homepage of the website Cardano website . Here, you can check the latest developments made by the Cardano blockchain. You can also check the previous details through this option, you can go to any date and see the developments made by Cardano on that date.
(5). Partners :
Cardano blockchain has 3 partners, IOHK, EMURGO, Cardano Foundation.
(1). IOHK : This company is developed by Jeremy Wood and Charles Hoskinson(Founder of Cardano). This company collaborated with Cardano to make blockchain decentralised, scalable, secure platform. It is one of the best companies that build decentralised technology.

(2). EMURGO : This will help Cardano blockchain by adding business to this blockchain. EMURGO also provides some courses on blockchain engineering and blockchain education.
(3). Cardano Foundation : This body will supervise the developments in the Cardano blockchain. It is the main body of Cardano blockchain so it mainly works on making partnerships and growing communities all across the world.
So, these 3 partners work together for Cardano blockchain and make it a more reliable platform.
(6). Team of Cardano
There are a lot of people who are fully dedicated and works to make Cardano better day by day. Cardano work along with IOHK , EMURGO to ensure that Cardano is being developed as a secure, transparent platform.
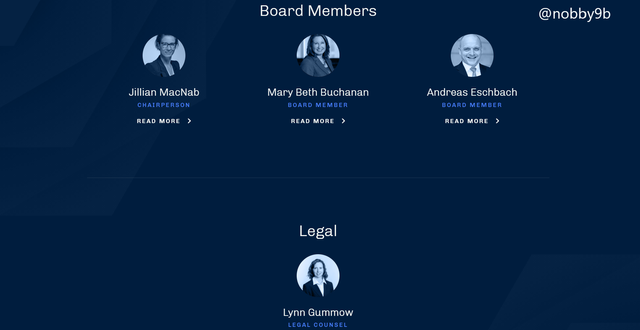
The Cardano has a diverse team of 24 nationalities, working across 15 different countries and still growing. There are around 250 developers working with Cardano blockchain. To get more details about all the members of the team check this link. Source :
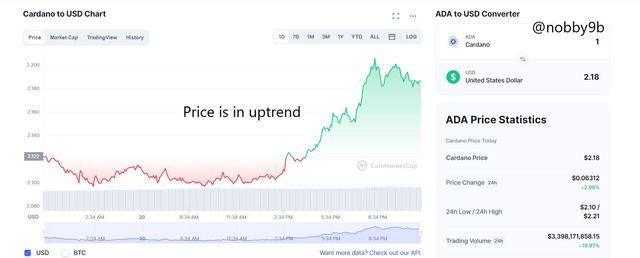
(7). Market Details
Price: $2.18
Volume 24hr: $3,398,171,858.15
Market cap: $71,875,813,793.76
Ranking: #4
Circulating supply: 32.9B ADA
The current rate of ADA at the time I am doing homework is $2.18 with 24-hours trading volume of $3,398,171,858.15 The CoinMarketCap ranking of Cardano(ADA) token is #4. The circulating supply of ADA token is 32.9B ADA
Here, a higher circulating supply means asset has very good liquidity and it is easy to make trades with asset. Some of the details of asset are :
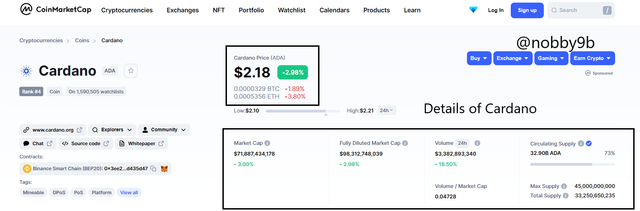
Price of asset is currently in uptrend. Cardano is ranked 4 on coinmarketcap website.
On-chain Analysis
For this analysis, I am using some websites. One of them is Cardano blockchain's explorer website. Cardanoscan
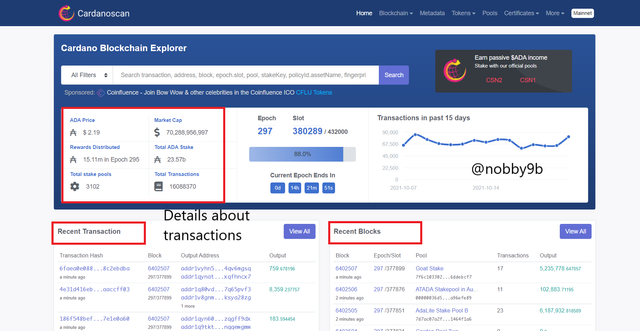
As you can see in the picture above. There are details about the Cardano blockchain. Currently, the total stake pool for Cardano is 3102. And total staked ADA token are 23.57B. You can also check the total transactions happen on the blockchain which are 16088370. You can also check the recent trend of number of transactions.
You can also check the latest transactions and recent blocks. You get all the details of transaction as transaction hash, block number,....etc. The number of transactions on blockchain gives you clear idea about the liquidity of asset. For further details follow this link. Cardanoscan
For more analysis I go to another website Coindesk
I here search for cardano blockchain and get following details. You can see the average number of transactions in last 7 days, highest/lowest number of transactions in last 7 days. You can also see the price trend and returns given by ADA token in last some months.
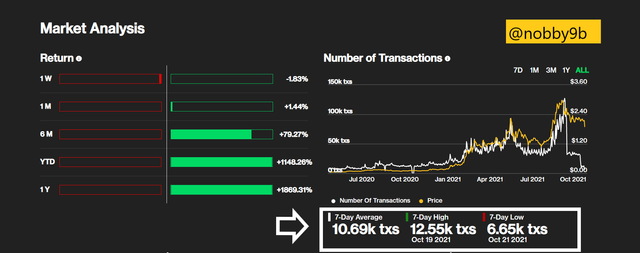
As you can see in the picture the return that ADA token gives in last 1 year is approx. +1869%. You can also see the trend in number of transactions. The average 7 days transaction of blockchain is 10.69k.
You can more explore about the blockchain details like price performance with respect to other popular assets, you can check the average time for which token is held with users, and many more.
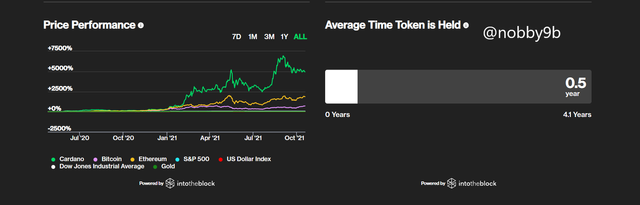
As you can see in the picture above the price performance of ADA token with respect to BTC, ETH, and with many more assets like gold, US Dollar index. In the picture above you can see the average time for which any user holds ADA token which is approx 0.5 years means 6 months.
Question : 3
Make a purchase from your verified account of at least 10 USD of the currency selected in the previous point. Describe the process. (Show Screenshots).
Answer :
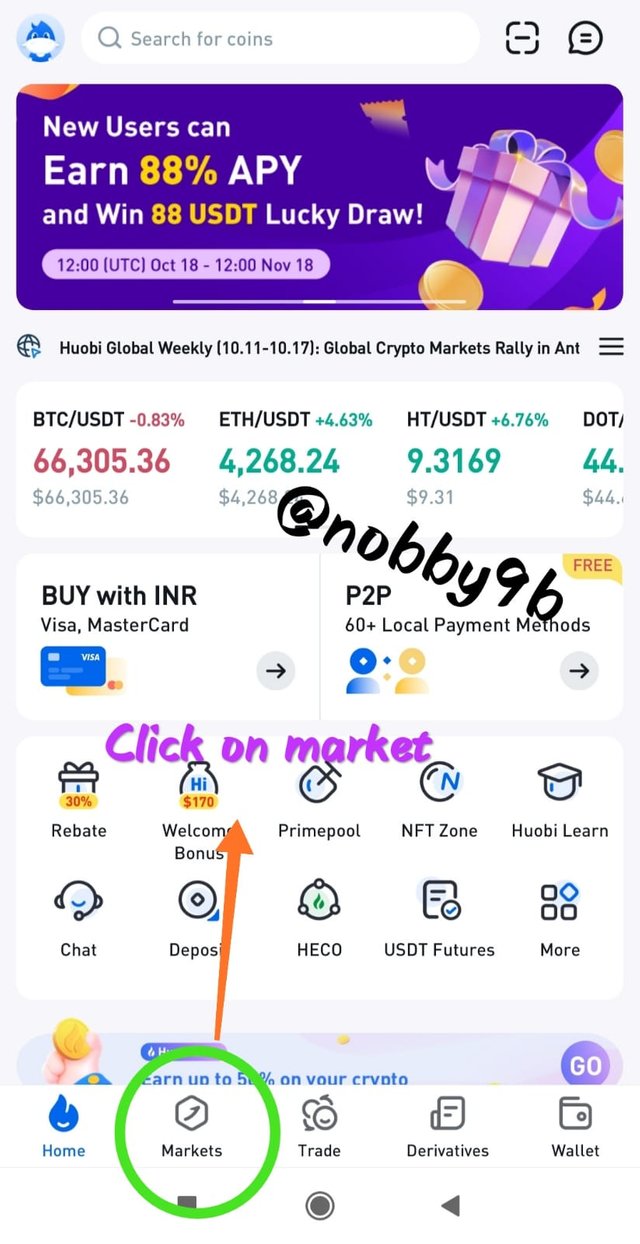
For this question, I am using my Huobi Pro account. To make a purchase in any asset that you want follow these steps :
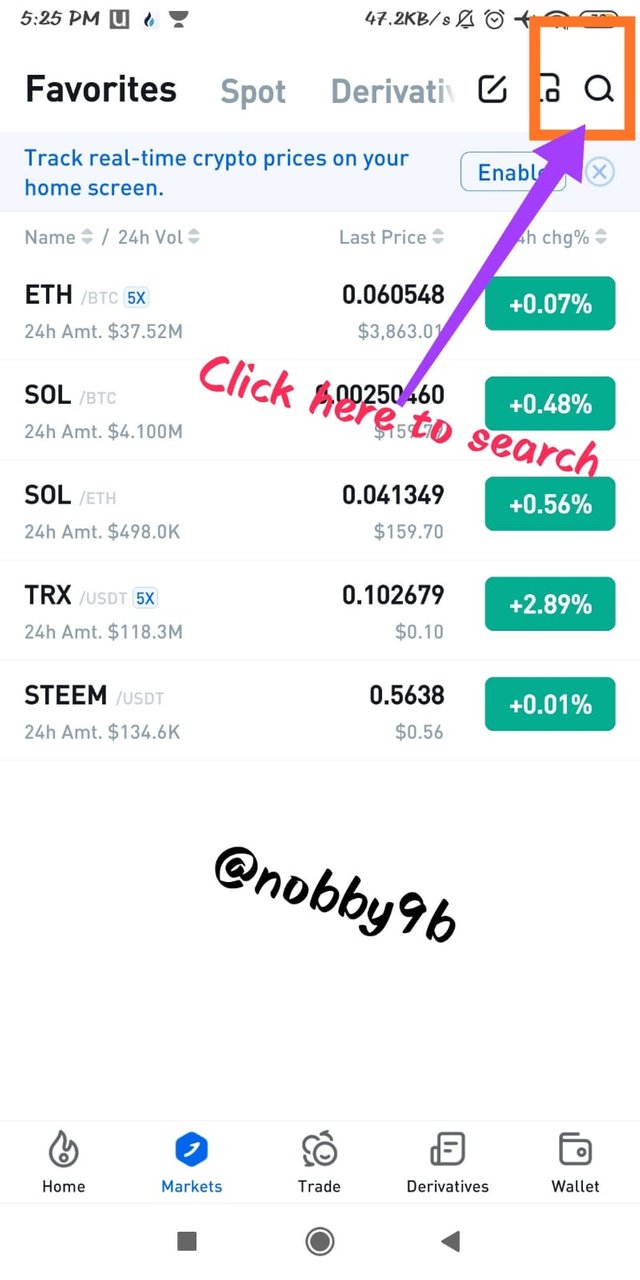
(1). Open your Huobi account and click on markets option.
(2). After that click on search icon shown at top right corner and search for your asset.
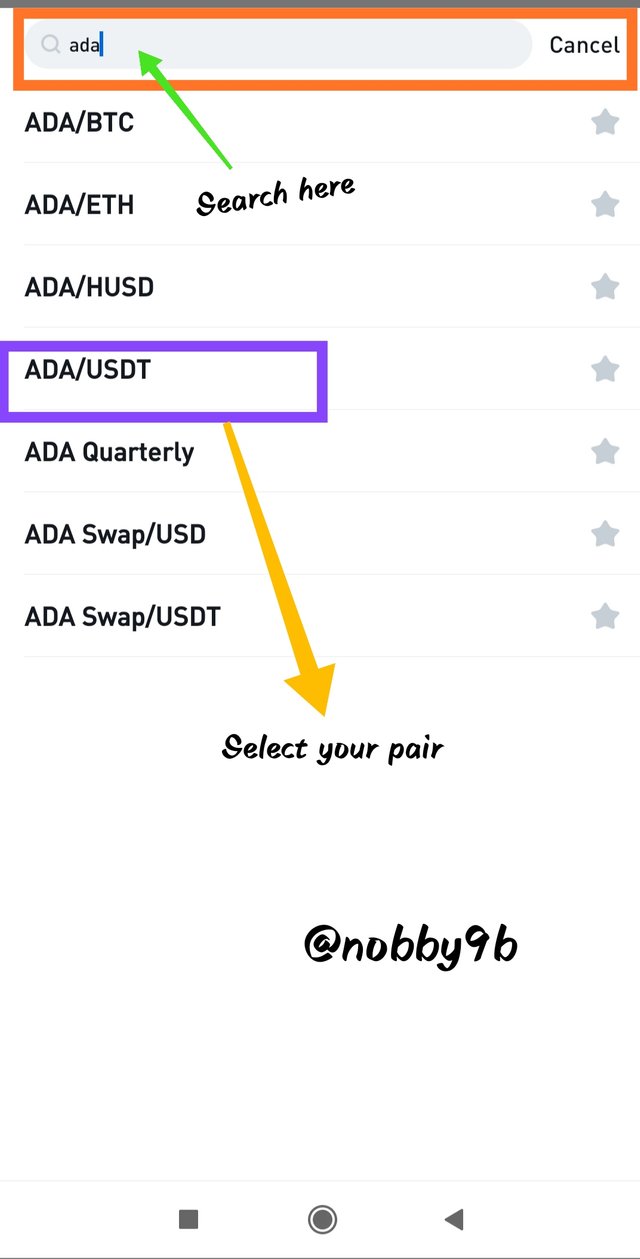
(3). Search for your desired asset in search bar. When you search you get a list of pairs for that asset choose anyone in which you want to trade. I here choose ADAUSDT pair.
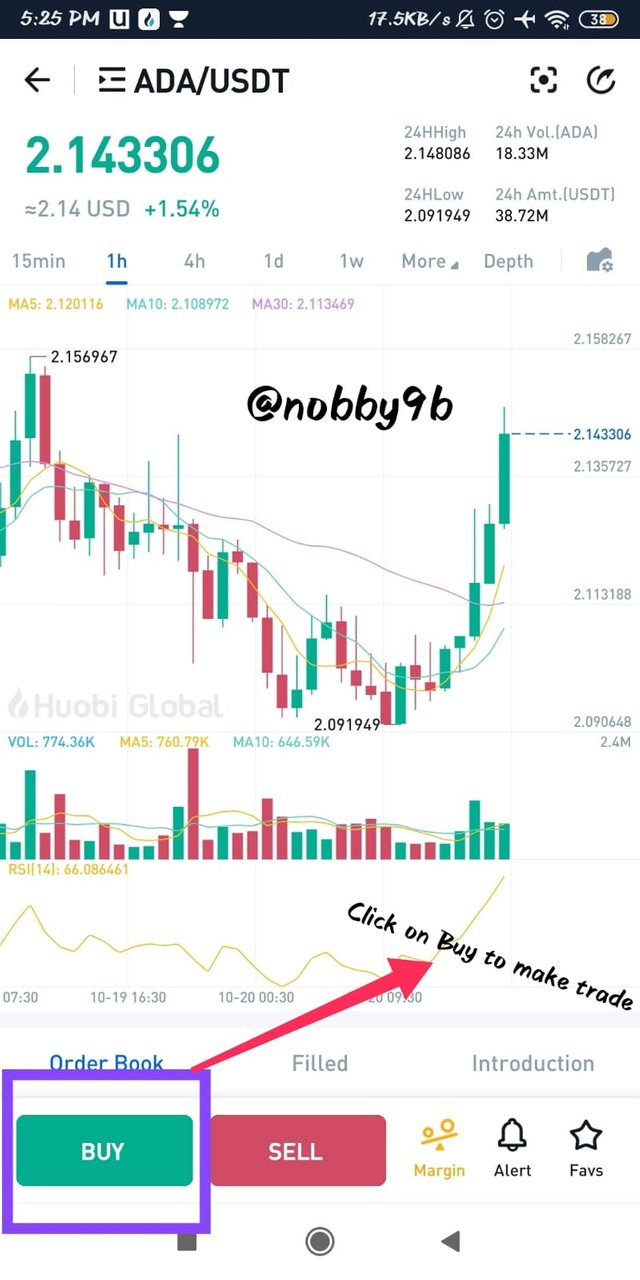
(4). Now, the price details and chart of asset opens up. You now click on the Buy option to make a trade.
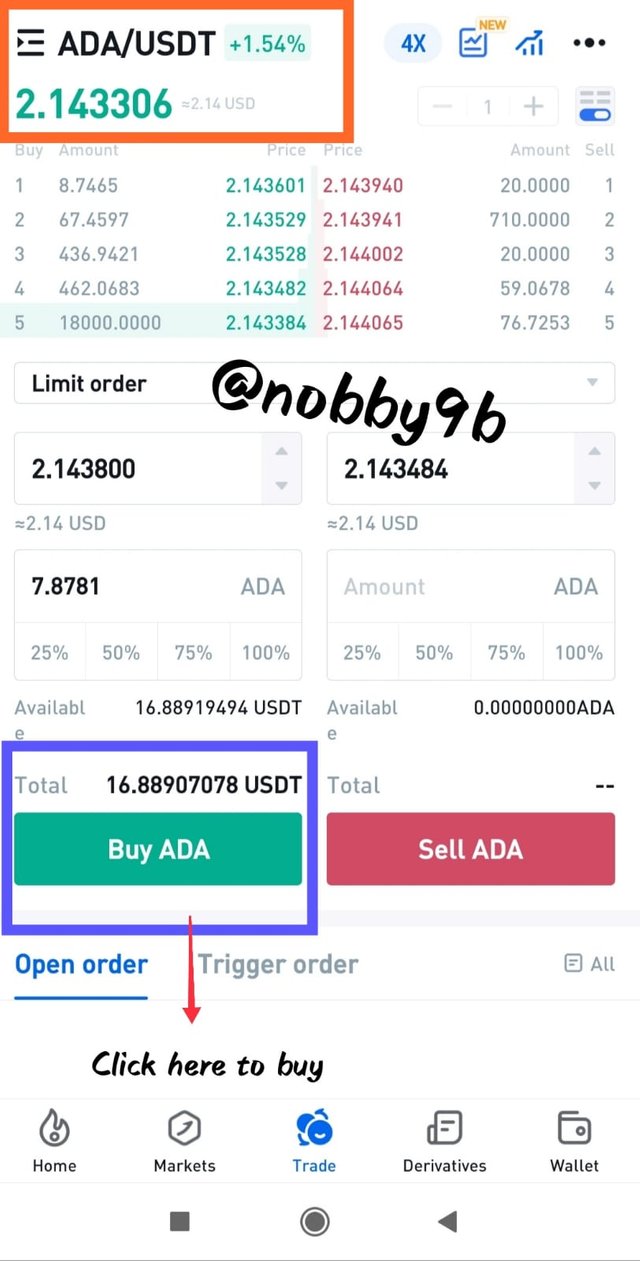
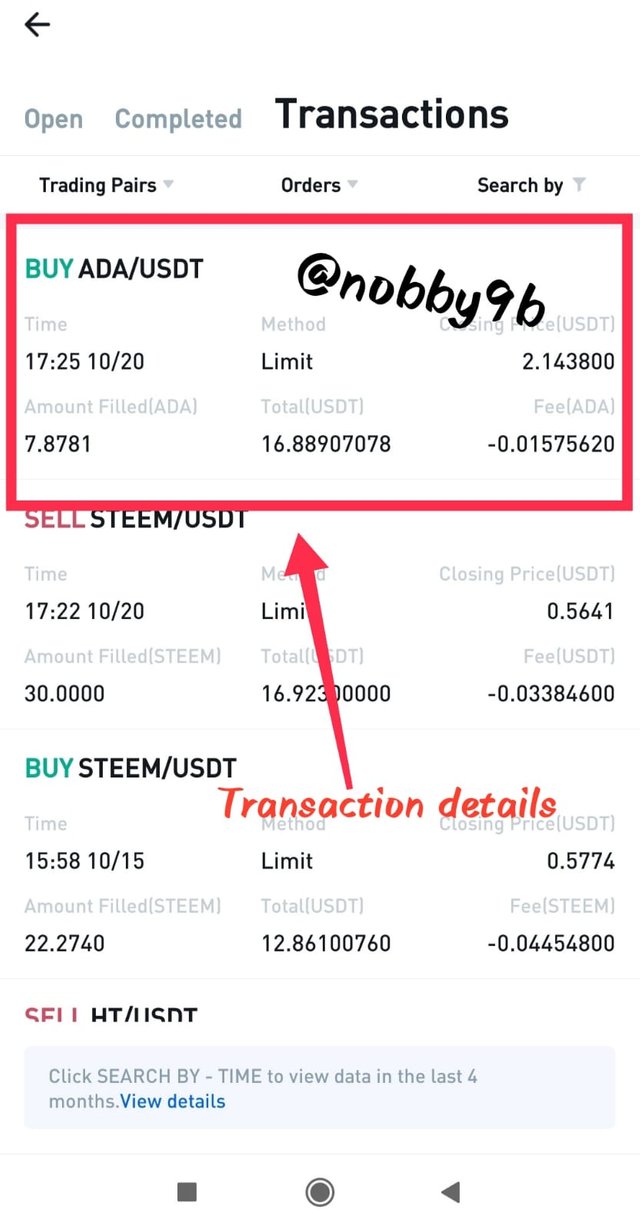
(5). Now you need to select the amount for which you want to buy that asset and click on Buy ADA. I here bought ADA worth $16.8
(6). You can check the trade details of my trades.
In this way, by following these steps you can make a purchase of any asset that you want.
Question : 4
Apply Fibonacci retracements to the previously selected asset with a 4 hour time frame on the platform of your choice. Observe the evolution of the price at 24 and 48 hours, did it go up or down in value? Look to identify resistance and support levels. (Show Screenshots at 0, 24 and 48 hours of purchase where the date and time are observed).
Answer :
About Fibonacci retracements
These are the horizontal lines that indicates where the resistance and support levels are likely to occur. These levels are generated from the Fibonacci sequence that was originated in the 13th century.
Each level of Fibonacci sequence is associated with percentage. These percentage levels tell about how much the previous move of price retraced. The main and important Fibonacci retracement levels are 23.6%, 38.2%, 61.8%, and 78.6%. And 50% level is also used by traders as an important level.
Price of asset is supposed to find resistance and support at these percentage levels. These levels are drawn between two important price levels which are the highest and lowest point of a trend.
Traders find this indicator very useful because Fibonacci Retracement Levels are used to find support levels, resistance levels, target levels, stop-loss levels. Let me give you a brief example of the use of Fibonacci levels in trade.
For example - Suppose an asset is in an uptrend for some time and it now started to go in downtrend. Now, we draw the Fibonacci Retracement Levels on the price chart of asset taking lowest point of trend as 100% level and highest point of trend as 0% level. Now, after a strong uptrend, suppose if the price of asset declined to 38.2% levels and asset's price started to see an uptrend. So, at this point of time price of asset stopped at Fibonacci level and finds support. So, this is a good signal for buy-side trade.
To know more about Fibonacci Retracement Levels please follow this link. Fibonacci Retracement Levels
My trade analysis using Fibbonaci
I here selected ADA asset for doing this analysis. I applied a 4hr time frame chart(as asked by the professor) and draw Fibonacci levels.
At 0 hours
I see a clear downtrend in price of ADA asset for some time and the price is now started an uptrend. I draw Fibonacci levels taking the highest point of trend as 100% level and the lowest point as 0% level. I then waited for some time and when the price crosses the 23.6% levels with a strong move and settled there for some, I made a trade entry at these levels. The picture below of 0 hours :
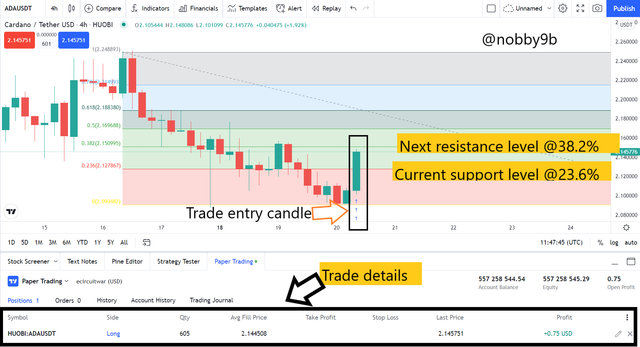
When the price goes in an uptrend after a downtrend, the price found resistance at 23.6% level, and once the price of asset crosses these levels and holds that gain for some time then this 23.6% level becomes the support level for the asset. Similar is the case with other Fibonacci levels. They work as resistance levels until the price breaks through them and once the price breaks these levels they became support levels for the price of asset.
Current support for asset @23.6% levels
Next resistance for asset @38.2% level.
At 24 hours
When I checked the asset's price after 24hours.During that 24 hours, I found that the price of asset found little resistance at near 78.6% level and retraced till 50% level. And after reaching 50% levels price of asset again found support and price goes in an uptrend. Price of asset fully retraced the previous downtrend before 24 hours.
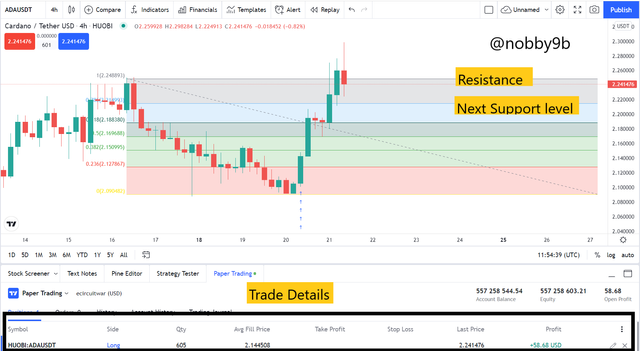
At the end of 24 hours, I needed to draw more Fibonacci levels to see the price trend, and I found that price goes till 127.2% level and at that level price found resistance and now price is retracing.
The current price at end of 24 hours, is now below 100% means the price does not find support at this level and expected to go further below. The price of asset may go further below and may find support now.
The next support level for the price is @78.6@ level.
Current resistance is @100% level.
You can check the trade details below. I am currently running on profits.
At 48 hours
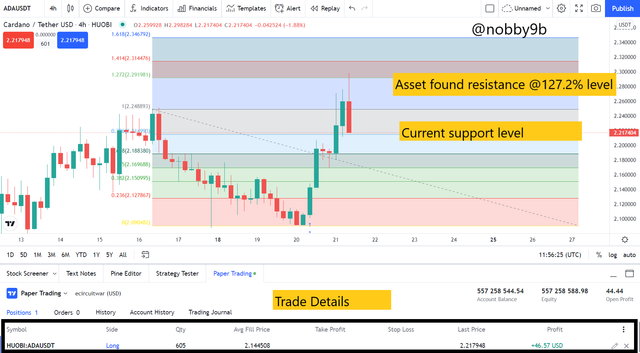
When I checked my purchase after 48 hours I found that the price of asset did not find support at 100% levels. The price of asset breaks the next support level of 78.6% and goes downwards. The price of asset found support at 23.6% level. After touching 23.6% level price of asset again found momentum and started to rise. As you can see that price rises till 78.6% level and finds some resistance there.
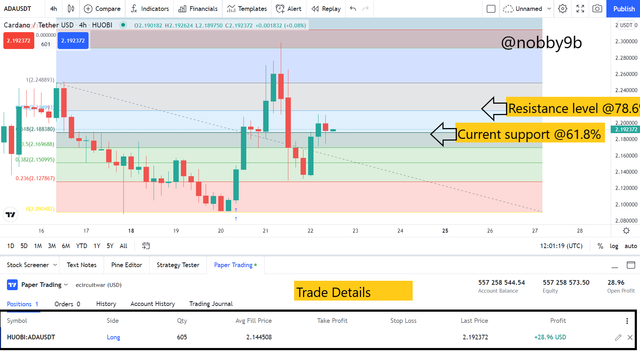
Current price of asset is near 61.8% level and this level works as the current support level for asset. And if price of asset breaks this 61.8% support level then the price of asset is expected to fall below. On the other hand, if the price of asset holds the current 61.8% support level, it is expected to go till 78.6% level. And at 78.6% level price may found some resistance and if price passes 78.6% level it is expected to go till 100% level.
Current support level for asset @61.8% level.
Next resistance level for asset @78.6% level.
In the below part of picture you can see my trade details that I initiated 48 hours before.
Question : 5
What are Bollinger Bands? How do they apply to Crypto Technical Analysis? With which other tool or indicator do you combine Bollinger Bands to analyze a Crypto? Justify your answer.
Answer :
Bollinger band is a technical indicator developed by John Bollinger in 1980 to find good trading signals. Bollinger band indicator works on moving averages. Bollinger band indicator is helpful for both swing traders or long-term traders.
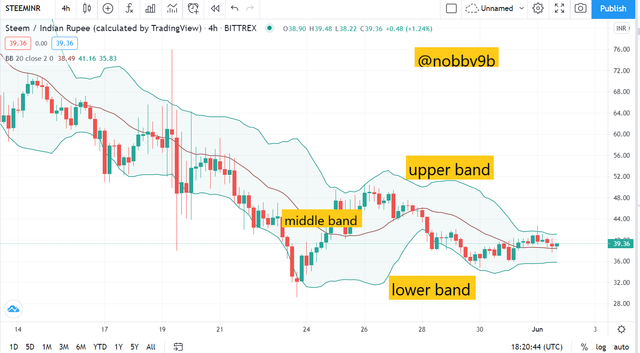
This indicator is made up of three parts : 3 bands.
These 3 bands/lines represent different things :
- Middle band/line shows Moving average line(generally, we use 20 days moving average)
- Lower band/line shows -2 Standard Deviation(S.D) from the Moving Average.
- Upper band/line shows +2 Standard Deviation(S.D) from the Moving Average.
Calculation of Bollinger Bands
As we already discussed, this indicator works on moving averages. And, as the word average is self-explanatory, it is the mean value of observations which we get when sum of all the observations is divided by number of observations.
Middle Band : This band is the average of the closing price of asset for 20 days(this can be more/less depending on the setting of the indicator).
Upper Band : This is Middle Band + 2 times Standard Deviation(Standard Deviation for 20 days).
Lower Band : This is Middle Band - 2 times Standard Deviation.
Working of Bollinger Bands
Trend Reversal
Bollinger Band helps to find out trend reversal in price of asset.
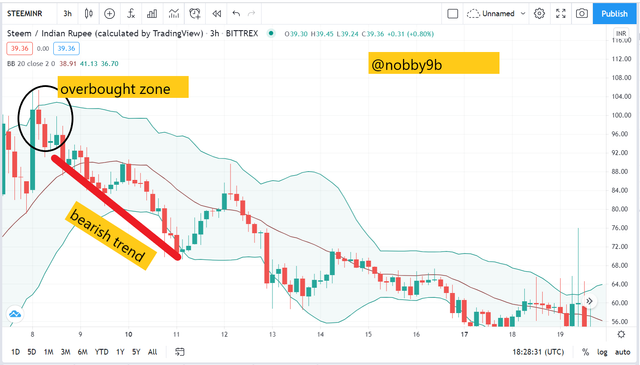
Overbought Zone/Downward Trend
When the price of asset touches the upper band of Bollinger bands then this indicates an overbought zone and a price reversal is supposed to happen soon. For instance, you can see the practical example of this below when price touches the upper band, the price of asset reversed.
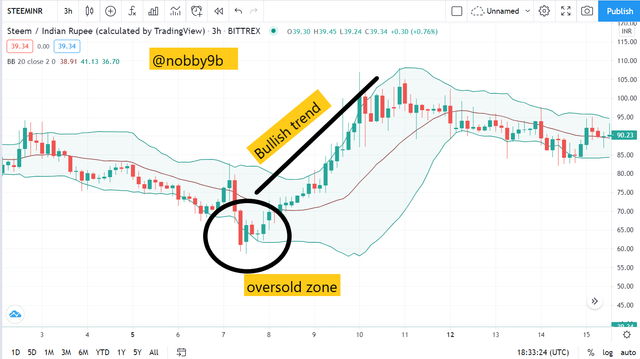
Oversold zone/Upward Trend
When the price of asset touches the lower band of Bollinger bands indicator this means an oversold zone and a price reversal is expected. You can see a practical example of this in the screen below, where price touches lower band and afterward price goes in uptrend.
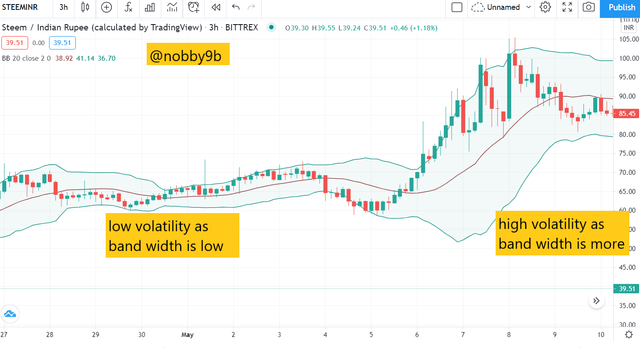
Volatility
You can also find the volatility in any asset using the Bollinger bands. When the width of bands increases that implies volatility increases. Similarly, when the width of bands decreases that implies volatility also decreased. For example, you can see in the picture that the width of bands is more when there is a larger price movement.
Best setting for Bollinger Bands
When we open the settings of Bollinger bands indicator we get the following important options :
Length : Default value of length is set at 20 which means it measures a moving average of 20 days.
StdDev : This setting is for Standard Deviation. We set its value at 2 which means -2/+2 deviation from moving average.
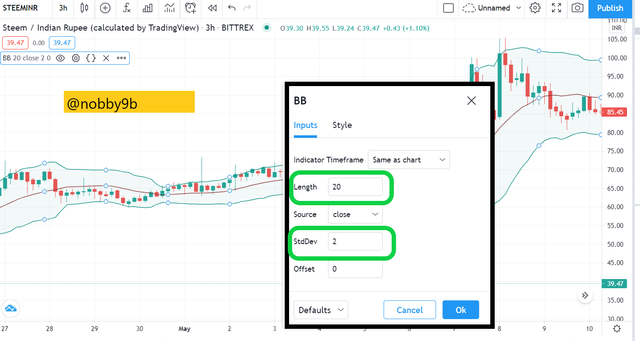
This is the best setting for Bollinger Bands Indicator because we get the best signals after these settings. These settings are good for best trend analysis using Bollinger Bands Indicator.
Determining Support/Resistance levels
It is very easy to find support and resistance levels using this indicator. Generally, we found support levels near lower band of Bollinger Bands and, we found resistance levels near the upper band of Bollinger Bands.
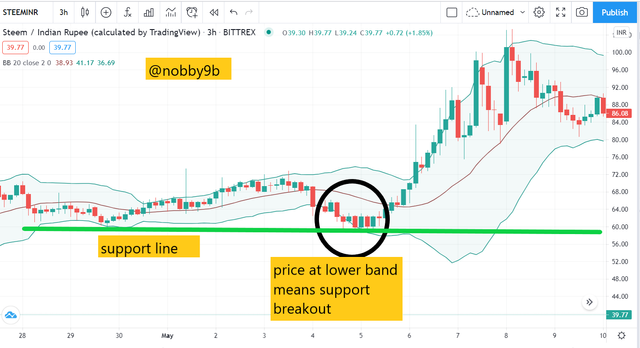
Practical example of support level :
As we said earlier, support levels are near lower band. When price of asset touches the lower band and the support level also exists there then price of asset gets support and rises in upward direction. And when the price touches the lower band and did not find support there, then it will gives a support breakout and price further goes in downward direction.
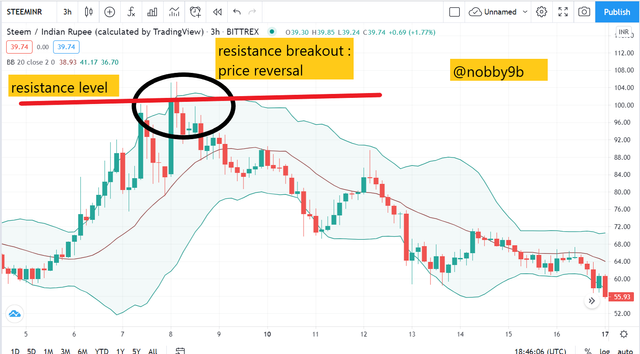
Practical example of resistance level :
This happens generally near the upper band of Bollinger band. When the price of asset touches the upper band, the price finds resistance and price reversal happens. When the price does not reverse from the upper band levels then this situation is known as resistance breakout and price further goes in an upward direction.
Signals using Bollinger Bands
We can find signals using Bollinger Bands easily. It is very easy to find trends and signals using Bollinger Bands.
Trends
When the bands of indicator are moving in a downward direction then this is the situation of a downward trend. Similarly, when bands are going in an upward direction then this is the situation of an upward trend.
Buy/Sell Signals
Buy Signal using indicator
When the price of asset touches the middle band of Bollinger bands in an upward move this indicates a buy signal and price of asset is supposed to show a bullish trend.
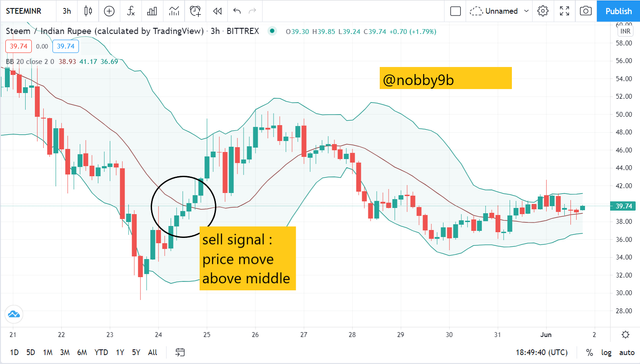
Now, you can see in the picture that when the price of asset moves above the middle band in an upward move this indicates a buy signal and uptrend.
Sell signal using indicator
When the price of asset moves below the middle band in a downward move this shows a sell signal and downtrend.
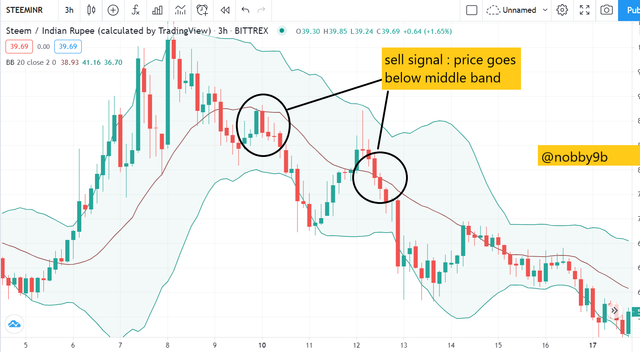
You can see a practical example of a sell signal using the Bollinger Bands indicator. As you can see when price of asset moves below the middle band in downward move a sell signal is generated.
Bollinger Bands with MACD Indicator
It is always good to use more than one indicator.Here, I am using MACD along with Bollinger Bands to make more good decisions.
It is good to you more indicators because it helps to filter out false signals from one indicator and provides strong signals.
About MACD
MACD stands for Moving average convergence divergence. It is a trend-following momentum-based indicator. MACD shows relation between 2 moving averages. This indicator uses two moving averages : one is of a larger time period and another one is of small time period.
MACD indicator gives sell/buy signals when it crosses below/above its signal line. MACD helps traders to understand the strength of a trend, whether the bearish/bullish movement in price is weakening or strengthening. For more details about MACD please follow this link. About MACD
To justify my using MACD indicator with Bollinger Bands, I am using a practical approach for this purpose. I use MACD with Bollinger Bands because when both the indicators are combined they produce strong signals and also filter out false signals. Some of the examples of signals from both the indicator are :
Sell Signal using both indicators
When the price of asset touches the upper band of Bollinger Band then this is signal for price reversal. At the same time MACD needs to give a sell signal by giving a crossover between macd line and the signal line. When both these situation combined together, they give a strong sell signal. For example -
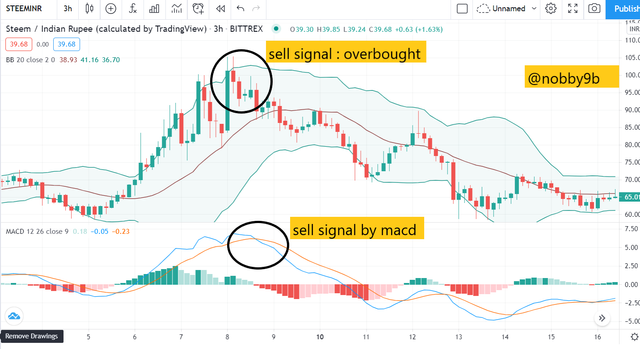
As you can see in the picture above, when the price of asset touches the upper band of Bollinger bands a price reversal happens in price of asset. At the same time MACD indicator also gives crossover between macd line and the signal line. So, this is a strong sell signal given by both the indicators together.
Buy signal using both indicators
When the price of asset touches the lower band of Bollinger bands this indicates an price reversal and price of asset is supposed to move in an upward direction. And, at the same time, this price reversal can be seen from the MACD indicator when a crossover happens between signal line and macd line. For example -
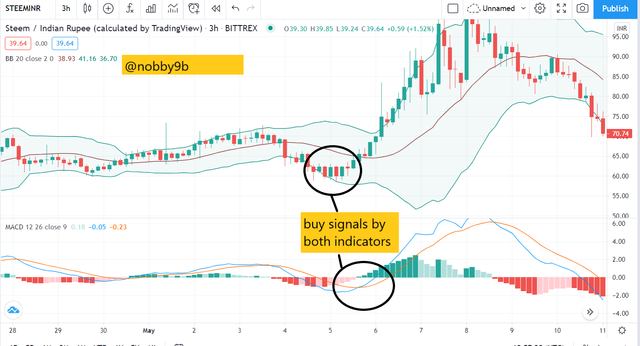
As you can see in the picture that when the price touches lower band of Bollinger band this indicates a trend reversal. At the same time, MACD gives a buy signal by giving a crossover. So, in this way we get a strong signal using both the indicators.
Filter False Signals
Using both the indicators also helps to filter out false signals given by Bollinger Bands. When the price of asset touches the lower band then it is expected that price of asset now reverses. But this does not happen all the time, the price of asset still goes in a downward trend after touching the lower band. During such situations, MACD helps to filter out signals. Suppose when the price touches the lower band but MACD does not give a buy signal at that time, this indicates that this is a false signal. For example -
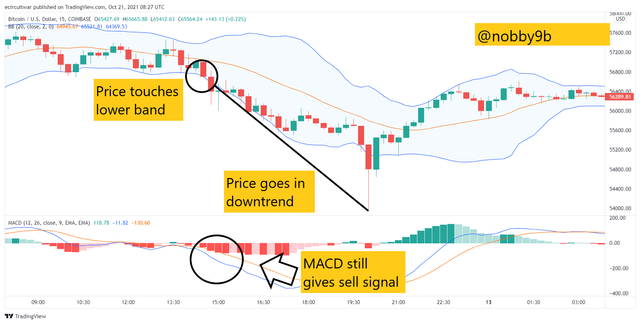
As you can see in the picture that the price touches the lower band and still continues the downward trend. But this signal is filtered out by MACD which still gives a sell signal. So, in this way MACD helps to filter out false signals.
So, using both MACD and Bollinger Bands helps to filter out false signals and also helps to find strong signals.
Conclusion
In this article, we learn about fundamental analysis and technical analysis. By fundamental analysis, we try to find out the intrinsic value of asset, and by technical analysis, we try to predict the future price of asset. Fundamental analysis is done by using all the information available about asset and technical analysis is done by using price charts. Usually, fundamental analysis is good for long-term investments and technical analysis is good for short-term trades.
In the next part of the article, we discuss about Cardano(ADA) blockchain. I did a fundamental analysis of Cardano blockchain and also invested in that blockchain.
In the last part, we did learn about Bollinger Bands indicator used in technical analysis. Bollinger Bands are very useful in determining the trend reversals. When this indicator is used with another indicator like MACD that will increase your success rate in trades.
Thank you for reading my post till the end. I hope you find it interesting and also learned something from it.
Gracias por participar en la Cuarta Temporada de la Steemit Crypto Academy.
Felicitaciones, continua esforzandote, espero seguir corrigiendo tus asignaciones.
Thank you professor for your feedback.
#club5050 😀
Thank You !!!
I will try my best to support #club5050 initiative.