[How to Trade Cryptocurrencies Profitably Using TD Sequential]-Steemit Crypto Academy | S4W8 | Homework Post for @reddileep
This is a homework post for @reddileep .
.png)

Question : 1
Answer :
Creation
TD Sequential is a technical indicator used by traders to do technical analysis. TD Sequential is created by Tom DeMark in the late 1970s. I think TD in TD Sequential indicator also stands for Tom DeMark. He created indicator to identify oversold and overbought areas and price reversal in the market.
Introduction
TD Sequential indicator is very useful for traders if they have proper knowledge about the indicator. This indicator helps to find trend reversals. As we all know about price reversals and price correction.
Price reversal is the situation when price of asset exits from one price trend and enters into a new trend. This is a long-term change means the price of an asset is now reversed.
Price correction is the situation when price of asset shows small time reversal after a long trend. This is very short-timed reversal and the price of asset again goes in the same previous trend direction.
These Price reversals and Price corrections are easy to find using the TD Sequential indicator. To put it in simple words :
TD Sequential is a tenchnical indicator tool created by Tom DeMark to identify the exact time for any trend exhaustion and price reversal. TD Sequential indicator can be used in any time frame but it is more reliable in larger time frames like 4 hours, 1 day, and above.
TD Sequential indicator analyzes the price data of asset and provides a good understanding of strength and weakness of
current market trend. It also tells about the likelihood of reversing the current market trend.
Key Features
(1). This indicator can be used in all time frames but higher time frames are more reliable.
(2). This indicator works only on Japanese Candles.
(3). This indicator helps to early-identify the market reversals.
(4). This indicator helps to improve the entry or exit points of your trade.
(5). This indicator anticipates market tops and bottoms and also easily find exhaustion zones in market.
Adding TD Sequential to charts
This is very important to know that how to add TD Sequential indicators to charts as we need to do this in further questions. So, follow these steps to add TD Sequential in any chart :
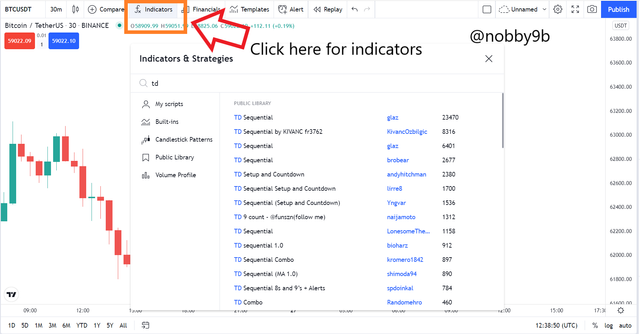
🔸 First, open any chart on trading view Source and click on Fx option.
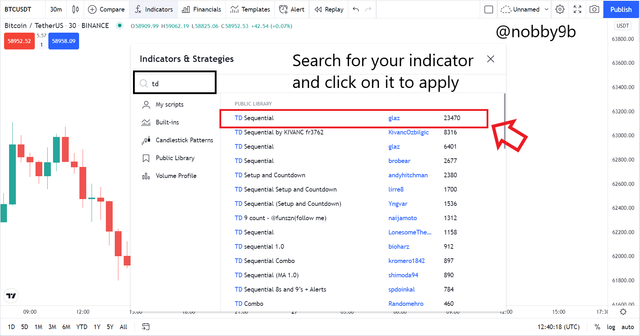
🔸 Search for your indicator and click on it to apply on chart. I here search for TD Sequential indicator.
🔸 Once you click on the indicator name, the indicator is applied on your charts.
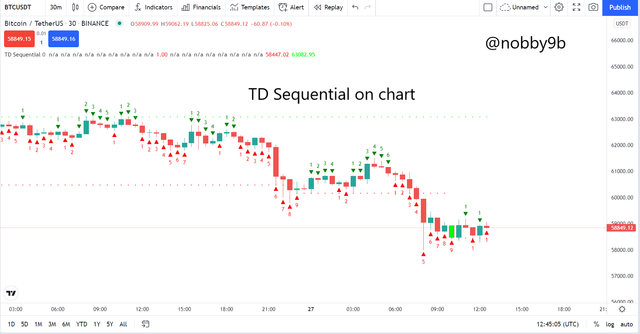
So, by following these steps we can easily add TD Sequential indicator to any chart.
Question : 2
Answer :
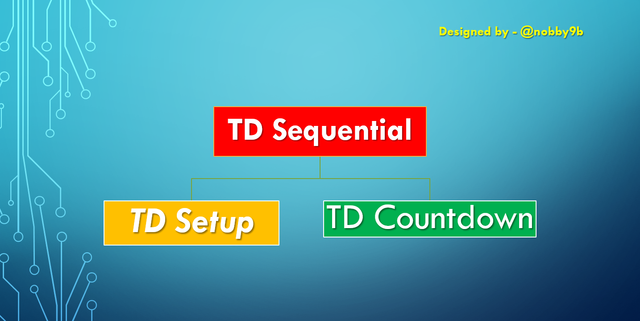
TD Sequential indicator has a number of different phases like TD Setup, TD Countdown, TD Camouflage, TD Clop, TD Clopwin, TD support level, TD resistance levels, TD Open, TD Trap, and many more. If we talk about the most useful and important TD phases then we have two phases: TD Setup, TD Countdown.
TD Sequential indicator analyzes Japanese candlesticks so it is must to use Japanese candles in the price chart. There is a marking on the top or bottom of each candle when we use this indicator. This counting helps to find trend reversals and market tops and lows.
As we already discussed TD Sequential indicator has two main phases : TD Setup and TD Countdown.
TD Sequential = TD Setup + TD Countdown
(A). TD Setup
TD Sequential indicator has two important phases. The first phase of the TD indicator starts with TD Setup. In TD Setup phase we have a 9-candle count. When this 9 candle count is completed, the price of asset is likely at the top and bottom of the market and a price reversal, price pause, price pullback is expected. Also, at this point, the second phase TD Countdown starts.
(B). TD Countdown
This is the second phase among the two important phases of TD Sequential indicator. This phase is valid only when the first phase that is TD Setup is completed. In this phase TD Countdown has a 13-candle count and when this 13-candle count is completed in the price of an asset, it is likely the top or bottom of the market. At this level price of an asset is expected to pause, reverse, pull back.
When TD Sequential indicator is applied to chart of any asset, it shows some number at the top/bottom of candles. The numbers that are on the top/bottom of candles, follow an ascending order from 1 to 9 in the TD Setup phase, and in the TD Countdown phase, these numbers on candles follow ascending order from 1 to 13.
As we know that we can find possible price reversals using these numbers. There are two kinds of setups possible one is buying setup and the other is sell setup.
Buy Setup
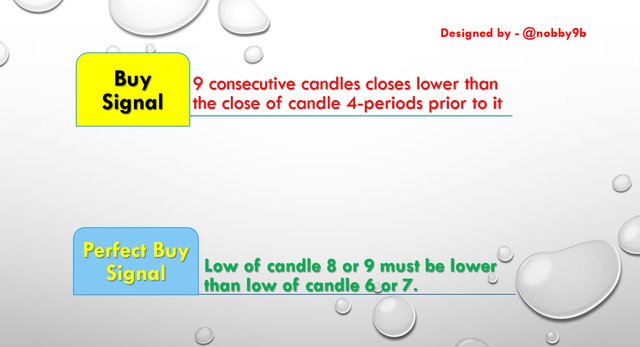
We get a buy signal when there is a downward trend in the price of asset. This is because we buy something when its price is low so in a downtrend price of asset is low so a buy trade is possible. For a buy signal there needed 9 consecutive candles, each of which closes under the close of the bar, 4 bars prior to it. For example -
Sell Setup
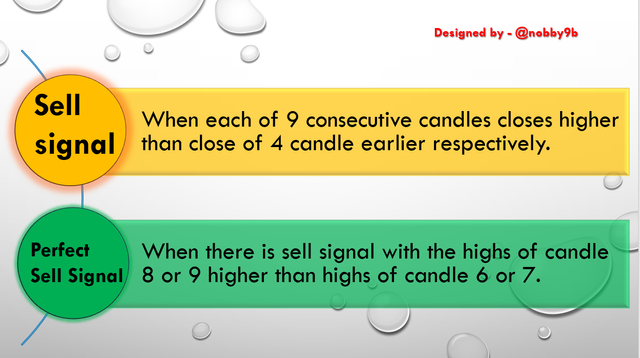
A sell signal is given when the price of asset is in an uptrend this is because we sell anything when its price is as high as possible. For the sell signal, we need 9 consecutive price candles each of them closes higher than the close of candle 4 prior to it. For example -
Question : 3
Answer :
As we all know that there are mainly two kinds of market trends one is bullish and another one is bearish. There is another trend called sideways but we here focus on bullish and bearish market trends and try to find TD Setup signal in these market conditions.
In a bullish market price of assets is going upward and it is good for a sell-side trade.
In a bearish market price of assets is going in the downward direction and this condition is good for buy-side trade.
Let us look at a brief explanation of TD Setup in a bullish/bearish market.
(A). When market is in Bullish Trend TD Setup(Market is bullish means good for sell trade.)
In this kind of situation, as the name suggests bullish trend setup, the price of asset is in an uptrend and this condition is good for a sell-side trade.
The first thing to be done is, the number 1 is plotted on the candle if it(candle) manages to close higher than the close of a candle that formed 4 periods before. This 4-period concept or rule is very important for calculating the TD Sequential as this process repeats again and again.
Similarly, the number 2 is plotted on a candle if the second candlestick manages to close higher than the close of the candle that if formed 4-periods ago. This process goes for all the remaining candles till number 9.
The point of reversal is very much expected when TD Sequential indicator plotted number 9 on a candle. To put it in simple words, when 9 consecutive candles managed to close higher than the close of candle that is 4-period ago it respectively. If this condition is satisfied then a price reversal is expected to happen.
Note :
If any candle closes lower than the close of candle 4 periods before the TD Setup is not valid.
For the perfect TD Setup, the highs of the 8th and 9th number candle must be higher than the highs of the 6th and 7th candle.
Example for Sell Trade
For a sell-side trade, we look at conditions that are mentioned above. The basic structure of sell-side trade is :
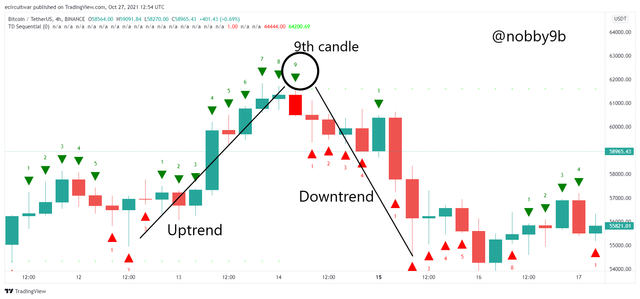
For a sell-side trade as we all know the price of an asset must be in an uptrend. And there should be 9 consecutive candles that close above the close of candle 4 periods earlier. Once these conditions are satisfied we get a sell signal. For example -
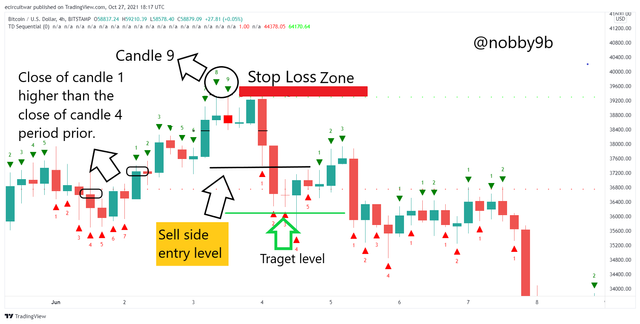
As you can see in the picture all conditions are satisfied for a sell-side trade. Price is in an uptrend, price of asset makes a high in the market and 9 candles are also completed so at this point price of asset is expected to reverse and the same thing happened in the price of asset.
As you can see all the conditions for sell-side trade are satisfied so we can make a sell-side trade. We take entry in sell-side trade when the 2 numbered candle breaks the number 1 candle's lower point. We put stop loss levels just above the highs of candle numbered 9.
(B). When market is in Bearish Trend TD Setup(Market is bearish means good for buy trade.)
This situation is exactly the opposite of the bullish trend situation. As the name says, Bearish Trend TD Setup, the price of asset is in a downtrend trend and this situation is good for a buy-side trade.
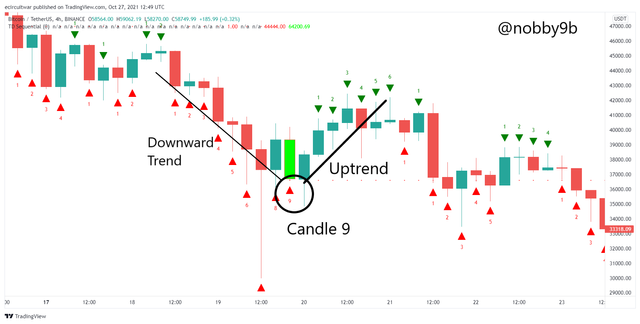
In Bearish Trend TD Setup, the number 1 is plotted on a candle if the candle closes lower than the close of a candle 4-period prior to it. And this 4-period rule is applied to all the following candles. When there are 9 such candles formed, there is a possibility of reversal in the price of asset.
To put it in other words, the point of reversal in the price of asset comes when the TD Sequential indicator plots number 9 on the bottom of candle. When each of 9 consecutive candles closes lower than the close of candle 4-period prior to it. This is the situation where price reversal is expected.
Note -
If any candle closes higher than the close of candle 4-period prior to it then the TD Setup is not valid.
For a perfect TD Setup, lows of candles 8 and 9 must be lower than the lows of candles 6 and 7.
Example for Buy Trade
The basic structure of a buy-side trade is :
For a buy-side trade as we all know the price of asset must be in a downtrend. And there should be 9 consecutive candles that close lower than the close of candle 4 periods earlier. Once these conditions are satisfied we get a buy signal. For example -
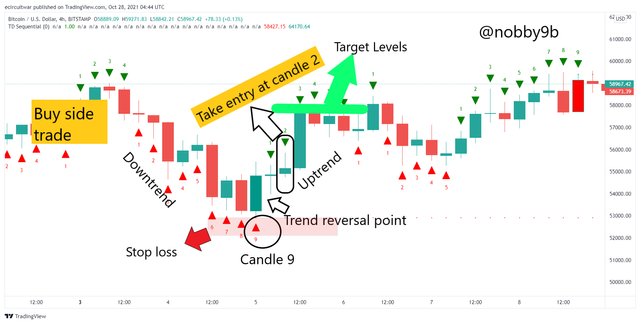
As you can see in the picture all conditions are satisfied for a buy-side trade. Price is in a downtrend, price of asset makes a low in the market and 9 candles are also completed so at this point price of asset is expected to reverse and the same thing happened in the price of asset.
As you can see all the conditions for buy-side trade are satisfied so we can make a buy-side trade. We take entry in buy-side trade when the 2 numbered candle breaks the number 1 candle's higher point. We put stop loss levels just below the lows of the candle numbered 9.
Trading Signals in TD Setup Phase
If any one of the above patterns either Bullish or Bearish is completed there is a high probability that the price of asset will reverse in the opposite direction.
The number 9 candle is, most ideal for entering into a trade opposite to the current trend. The stop-loss levels should be kept below/above the lows/highs of the 9th candle. If the pattern plays out, then there must be a strong pullback during the first 3,4 candles after candle number 9.
When the 9th candle is formed in the price chart of asset, and none of these candles crossed its line of TDST resistance/support, then there is a very high probability of price reversal. In an ideal situation, the 9th candle should close near its TDST line. And if the TD Setup is perfect, we can get 3,4 strong candles in the opposite direction of the current trend.
Note -
(TDST line is a line of support and resistance inbuilt in TD Sequential indicator. This line is shown as a dotted line in the price chart and works as a resistance/support level for the price of the asset. These lines are drawn based on TD Setup and show very strong resistance/support levels.)
Question : 4
Answer :
Trend reversal is the situation when the price of asset in any trend and soon the trend of asset's price changes. A bullish trend is reversed when the downtrend in the price of asset starts and similarly, a bearish trend is reversed when an uptrend starts.
Bullish trend reversal
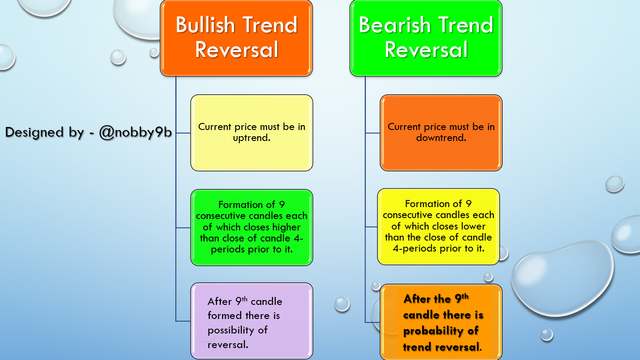
This situation comes when price of asset is in an uptrend for some time. When the price of asset is enough high then the price reverses and goes into a downtrend.
When the price is in an uptrend there is a point when the price is in the overbought zone and now everybody wants to book profit and exit from their positions. At that point of time TD Sequential indicator helps us to find such overbought zones.
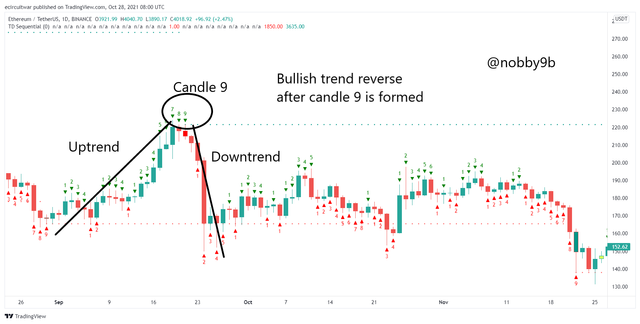
As you can see the market is in an uptrend and reaches a high point. Now, it's time for reversal in price, and When the TD indicator indicates 9 consecutive candles each of which close higher than the close of the 4-period prior candle. This situation gives a clear indication of a trend reversal. And as you can see the price of the asset is reversed after 9 such consecutive candles are formed.
Bearish Trend Reversal
A bearish trend in asset arises when the price of asset is in a downtrend for some time. A bearish trend reversal is a situation when the bearish trend in the price of an asset is ended and the price of the asset started to move in an upward direction.
A bearish trend reversal happens when the price of asset is enough low and the price now comes in the oversold zone. At this point, many buyers get active and start buying the asset and taking the price of the asset higher.
We can find these oversold zones where the price of assets is expected to reverse with the help of the TD Sequential indicator. To identify bearish trend reversal in TD Sequential, there must be 9 consecutive candles each of which must close lower than the close of the candle 4-periods prior to it. Once all these 9 candles are formed then we can say that a price reversal is expected after the 9th candle.
.png)
As you can see in the picture price of the asset is in the bearish trend for some time and completes 9 candles, each of them closing lower than the close of the candle 4-periods prior to it. And once the 9th candle is formed a price reversal is expected according to the rule and as you can see when the 9th candle is formed a price reversal happened.
Question : 5
Answer :
In this question, we look at some practical work. For the analysis of the chart, I am using the Trading View website Source. I first analyze the asset price chart and trade in my Huobi Pro account. So, let's start.
I here choose BTCUSDT asset and I opened 4hr chart of asset and applied the TD Sequential Indicator. I choose 4hr time frame because it is more reliable to use higher time frames if you are using TD Sequential indicator. I want to make a buy-side trade here. For that some conditions or say rules need to be followed :
First, the price of asset must be in a downtrend as we buy something when its price is as low as possible. For a good trend reversal and buy point signal, there must be 9 consecutive candles and each of them must close lower than the close of candle 4-periods prior to it. If both these conditions are satisfied, there is a high probability of trend reversal. In this case when there is a bearish trend that means a bullish trend is expected to start after the formation of the 9th candle.
.png)
As you can see in the picture above, the price chart of BTCUSDT, I waited for some time and I found that condition where both the conditions are satisfied. As you can see the price of the asset is in a downtrend and also 9 candles formed, each of which closes lower than the close of the candle 4-periods prior to it. When I see both these conditions satisfied, I get the hint that there is a high probability of trend reversal here.
But, before making any foolish trade, I make it more clear that this is a good buy-side trade.
Confirmation of Buy Structure
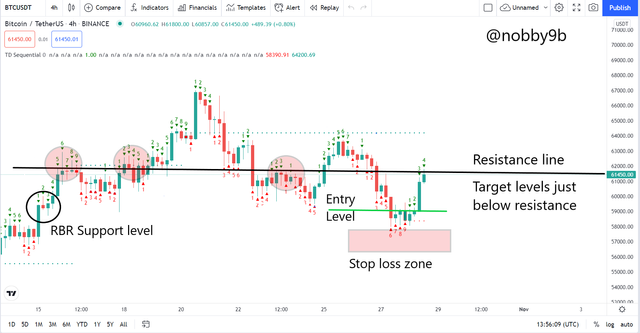
There is a pattern or say a formation known as RBR means Rally Break Rally. In this structure price of the asset is one rally(upward/downward) and a break comes means the price either reverses or consolidates for a small time and again starts the same rally. This structure gives very good support/resistance levels for any asset.
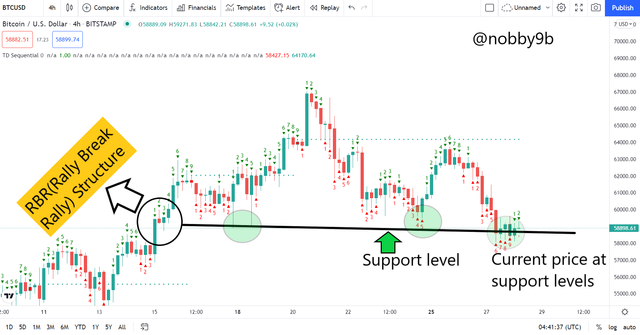
When we took a closer look at the price chart of asset we see this RBR structure and this works as a support level for the asset. As you can see the price of asset comes to these price levels 2,3 times before and gets support there and rises again. Even now, the price of asset is at this level means at the support level. So, this is another indication that the price of asset is going to rise from this support level if the price crosses the support level in an upward move. And as you can see the price of the asset crossed above the support level indicating a good signal for buy-side trade.
Confirmation from Indicator
As our buy-side trade is almost confirmed but to further prove it. I use a technical indicator known as Bollinger Bands. I applied this indicator to charts and see that price of asset is very close or almost touched the lower band of the Bollinger Bands indicator. This is an indication that the price of asset will rise in the upward move from this point. So, this indicator also confirms our Buy Side trade. To know more about Bollinger Bands Indicator, follow this link Source : Bollinger Bands.
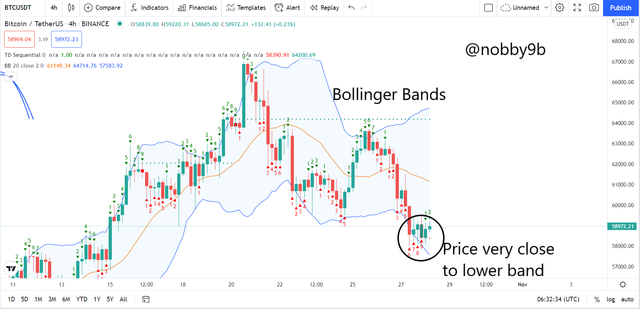
As you can see in the picture above the Bollinger band indicator on the price chart of asset. You can see that price of the asset just touched the lower band of the Bollinger bands indicator and this gives a signal that the price of the asset will now move upward from this point.
So, by getting signals from more than one source I make a trade. Let us see the proper trade setup of my trade.
Trade Setup
Here, we will see how to find a trade entry level, stop loss level, and target levels. I here show my trade setup with details like entry-level, stop loss level, target levels, and others.
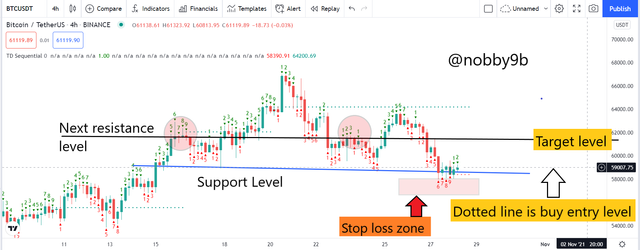
Let us discuss the trade setup of my trade that can be seen in the picture above. We will see how to find different price levels for trade using TD Sequential indicator.
For trade entry point
For finding a good entry point for buy-side trade, we need to look at the following :
(1.) In the TD Sequential indicator ideal entry should be at the 2nd candle when the price of asset crosses the highs of the 1st candle. So, in my trade, I also followed this procedure and make entry at the 2nd candle of TDSetup when the price crossed the highs of the 1st candle.
(2.) When the price of the asset is consolidating in the support zone then we should initiate a buy trade after the price has crossed the support zone in the upward move and similarly, we should start a sell trade if the price did not hold the support levels means when price crosses support zone in a downward move.
In my trade, I followed this rule and when the price crossed the support zone in an upward move, I made a trade. So, by following these simple steps you can make the trade at good levels.
For target price
Generally, in the case of the TD Sequential indicator, we put target levels at the recent resistance levels. So, the same rules I followed and put target levels just before the recent resistance levels. And as you can see in the picture the price of asset is facing some resistance at these levels for some time. I circled the reversals that happens at this resistance level in the recent past. So, taking recent resistance levels you can put your target levels using TD Sequential indicator.
For Stop loss
It is not always possible that all your trades go in the desired direction. Sometimes price does not go in the expected direction in that situation Stop-loss levels play an important role. These levels help you to maintain your risk-reward ratio.
Here, in the case of the TD Sequential indicator, we can put stop loss levels at slightly below/above the support/resistance zone or at slightly below/above candle 9's low/high. You can put one of these levels as your stop-loss level. Stop-loss levels depend on the user that how much he is willing to take risks so, you can put stop loss either at slightly below/above the support/resistance zone or below/above 9th candle low/highs.
In my trade, I also followed these steps to find my stop loss levels and put my stop loss at slightly below the lows of the 9th candle.
So, in this way you can find stop loss levels for your trade using TD Sequential indicator, these levels are very helpful to maintain a risk-reward ratio of your trade.
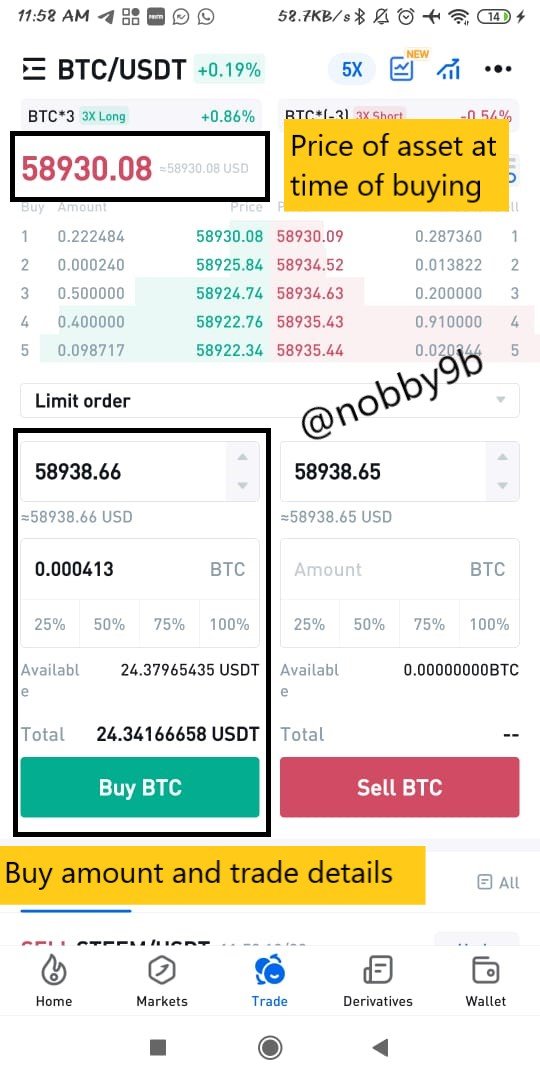
In this way, I found all the important levels for my trade. And, when the price of asset crossed the highs of 1st candle and also crosses the support zone. I initiated a buy-side trade. You can see my trade details below :
.jpeg)
As you can see, I initiated the trade on the levels that I mentioned in the trade setup picture. Once I initiated the trade, I waited for some time for my target levels which I set as slightly below the next resistance level. After a while you can see the price chart of assets:
As you can see the price of the asset has come very close to the resistance line and my target levels are almost achieved. So, I took my phone and exits from the position at slightly below resistance levels. My trade exits details can be seen in the picture below :
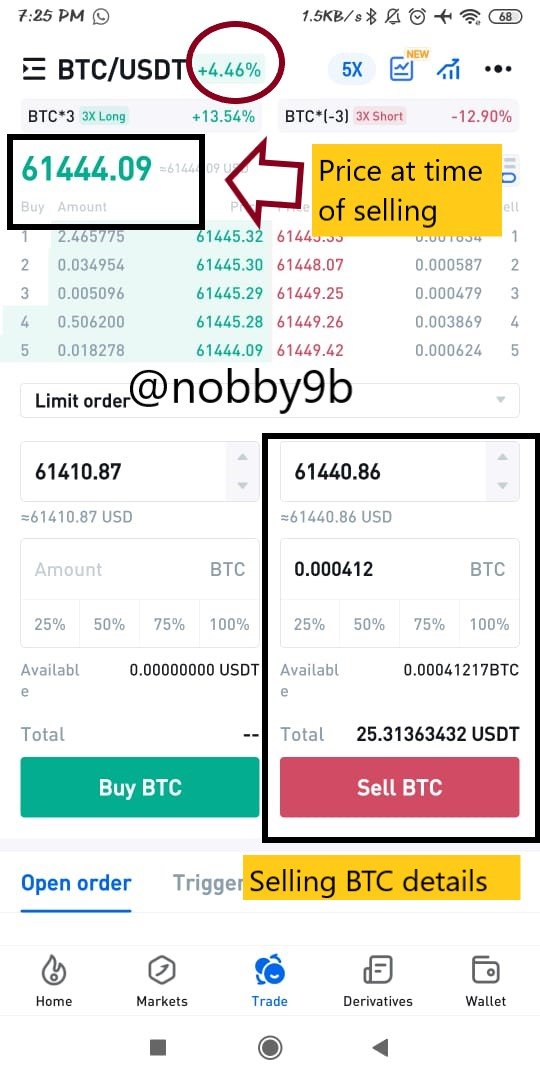
.jpeg)
So, in this way you can make trades using TD Sequential indicator.
Let me sum up all these details of how to make a trade. Details of my trade are :
Entry levels : $58938 (Entry at candle number 2 after price crossed the support zone in the upward move and after price crossed highs of candle 1.)
Target levels : $61450 (Target price are just below the next resistance levels)
Support levels : $59500 (Support from some time and also confirmed by RBR structure)
Resistance levels : $61550 (Resistance level for the asset from some time.)
In this article, we learn about the TD Sequential indicator. TD Sequential indicator is a very useful technical analysis tool if learned properly. This indicator aims to predict the exact time of price reversals. TD Sequential indicator uses the Japanese candlestick, price patterns to give the signal of possible reversals.
TD Sequential indicator can be used in all the time frames but it gives more reliable signals for larger time frames like 4 hours, 1 day, and more. However, this is a complex indicator and there are many conditions needed to follow so we should not expect many trading signals from this indicator.
Trading signals are generated when 9 candle TD Setup is completed. When the 9th candle of TD Setup is formed, a trend reversal of at least 3,4 candles is expected. TD Sequential indicator gives both kinds of signals for buy-side or for sell-side.
In the last part of the article, we learn how to use TD Sequential indicator practically and how to find important levels for a trade.
I hope you like my article and learn something from my article. Thank you for reading my article.
#club5050 😀