Crypto Academy Season 4 | Intermediate course by @allbert –week 1: Trading with Strong, Weak and Gap Levels
Hello Steemians,
This is a homework post for professor @allbert . In his lecture of season4 week 1 professor explained about trading with strong,weak and gap levels in market.
.png)

Question : 1
Graphically, explain the difference between Weak and Strong Levels. (Screenshots required) Explain what happens in the market for these differences to occur.
Answer :
Before we start discuss about strong and weak levels let us first talk about what these levels are. So, here levels are support and resistance levels.
Support Level:
This is the level in price of asset where the price of asset takes support means bounce back upside from this level. Support and resistance levels are simply horizontal lines on price chart of asset, here at these levels there is a possibility of trend reversal.
FOR EXAMPLE :

Picture of DOGEUSDT in 1hr time frame.
Here, in picture you can see that price of asset bouce back from the support level.
Resistance levels:
These are the levels in price of asset where price of asset finds it difficult to cross that levels therefore levels from where price of asset shows retracement are basically known as resistance levels.
For example :

Here, in the picture of DOGEUSDT asset in 1hr time frame, you can see that price of asset retrace from resistance levels.
So, these support and resistance levels are of two type one is weak level and another is strong level.
Strong Levels:
These are the support or resistance levels where price retrace its paths after touching these levels several times. So, here at these levels the possibility of trend reversal is higher and price actually reversed from those levels many times, so, those levles are known as strong levels.
Strong level is basically a line drawn on the price chart of asset as you can see in the picture below:

As here you can see a strong resistace level. At these levels price retraces several times.
Weak support and resistance levels
These are the resistance/support level where price reversal happens once or twice at max. These levels are called weak levels because the possibility of reversal at these levels is very low.
When these weak levels come then a breakout happening has more possibility than a reversal.
For example :
Weak resistance:

As you can see in picture a weak resistance level. Price at that level reversed only once and the happening of breakout at this level is more possible. and as you can see a breakout has occurred crossing the resistance level.
Weak support :

You can see an example of weak support levels in picture. Here price reversal happens only few times and that why it is a weak support levels and the breakout is might possible here and as you can see price breakout the weak support levels.
Scenario at support/resistance levels:
Support/Resistance levels are usually recognized by traders where there is a possibility of trend reversal. Support level comes at reversal after downtrend and resistance level comes at reversal after uptrend. These reversals happens because of concentration in supply.
These levels are imaginary horizontal lines which are drawn based on the sentiment of markets.
For any price level either support level or resistance level. There are three possibilities which are :
Those traders who are on buy side (long) are waiting for price to rise.
Those traders who are on sell side (short) are waiting for price to fall.
Those who are just watching the market and sideways.
So, when price is near support level and price rises from that support levels and then long side (buy-side) traders might add more to their existing positions at these support levels making price go higher. At the same time traders who are on short side might exit from their positions as price bounce back from support levels. At the same time when market find support the trader who are sideways now initiate there trades in buy side making price go further higher.
Hence, when all these traders initiate their trades in buy side that will make that price level a strong level and prices tends upward.
The same case happens during the fall in price of asset. When price comes at support level and did not hold the level and gives a breakout the short side traders add more to their positions and long side traders cancel their existing long positions and sideways trades now make short side trades. So, during this case all traders are on short side so price breakout the levels.
Similar, thing happens at resistance levels.
Question 2:
Explain what a Gap is. (Required Screenshots) What happens in the market to cause It.
Answer:
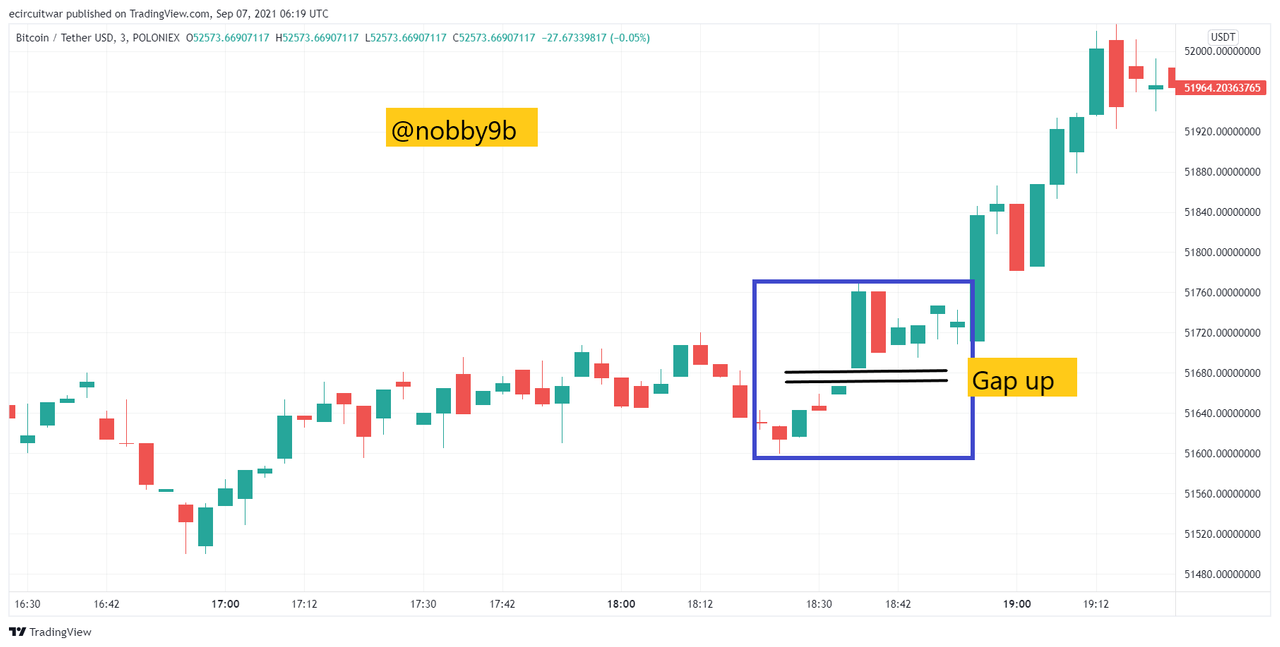
Gap is created when price jumps from one price level to another price level directly. Gap is basically created when price of asset jumps suddenly due to high volume traded in it. This gap is the space between two candles where no trade happened. There are mainly two types of gap :
Gap up
Gap down
Gap up situation arises when there is gap between the lowest part of candle is higher than the upper part of previous candle.
For example :
Gap Down situation arises when there is a gap between the lowest price of one candle is higher than the highest price of immediately next candle.
For example :

Let us try to understand this gap with help of an example.
Chart in 15min time frame.
Suppose price of asset is at $100 at say 10 A.M.( higher part of 15min candle) and at 10:15 A.M when a new candle started the price of asset suddenly started from $105. So, there is no trading happened between $100-$105 because that asset never traded at that price range. This no trading area in chart is known as a gap these are basically created when there is a sudden large volume traded in asset.These gap are basically works as support/resistance levels for the asset.
Question : 3
Explain the types of Gap (Screenshots required, it is not allowed to use the same images of the class).
Answer:
There are some types of gaps. A few of them are:
Breakaway Gap
In breakaway gap, the gap will break the current trend and start a new trend. This gap is now work as a support/resistance level
When price of asset breaks the trend with gap then this breakout is interpreted as a strong sentimental move. During gap creation gap always plays an important role one must look at these volume level during breakaway gap. When there is a large volume then the gap created has less possibilities to return back to fill the gap. And when volume traded is low then there is a possibility of filling that gap before starting new trend.
For example:
When a uptrend is break with gap.
__

Another example :

Runaway gap
These gaps are formed in the continued trend , or say , formed in the middle of trend. This happens because the previous trend is not over yet and just in its initial stage. At this point of time a large voulme is traded and this will cause the continuation of trend.
These gaps are very hard to find out and many traders might confuse these gaps with other gaps.These gaps might work as support or resistance levels.
For example :

Exhaustion Gap
This gap simply tells us about the end of trend. We can find out difference between runaway gap and exhaustion gap only during the reversal day when the exhaustion gap is filled. When exhaustion gap is formed with large volume then there is more possibility that market is exhaust and existing trend pattern is bring to an abrupt stop and that stop is followed by new trend pattern usually. These kind of gaps(Exhaustion Gaps) are not regarded as major trend reversals.
For example :

As you can see in the picture first a gap down happened amd later this gap is filled up.
Note :
Please be careful while finding out different kind of gaps. Traders usually confuse between Exhaustion Gap and Runaway Gap that confusion might leads to serious loss. Pay careful attention to volume while finding the Gaps , this will help you to find out gaps with higher success rate. As higher volume comes with Exhaustion Gap.
Question : 4
Through a Demo account, perform the (buy/sell) through Strong Supports and resistances. Explain the procedure (Required Screenshots).
Answer :
Here, for making my trades I take help of BRB strategy along with strong levels. In BRB what usually happens is prices breaks the strong level then retest these strong levels and after retest bounce back again.
Here I will show you a Buy side trade using BRB and strong levels. Same procedure is being followed if somebody wants to go for sell side trade.
Here, I trade ADAUSDT asset.

As you can see from the picture. Black horizontal line shows the strong resistance level as price retrace from that level these retrace can be seen as blue circles in picture.
Now the price break this strong level which can be seen in black circle in picture.
Once price breaks these levels then it again comes to retest these level which can be seen in blue rectangle in picture.
Once price retest these levels now price bounce back from the strong levels and breaks the previous swing high which you can see in picture.
So, here all the condition of BRB strategy are fulfilled and once the price of asset breaks the previous swing high we initate or trade with atleast 1:1 risk-reward ratio.
So, when price breaks the previous swing high level I initated my trade whose details can be seen in bottom of picture. (The blue line in picture shows my entry level in trade.)
After initate my trade you can see now what happens, in picture below :

As you can see next candle is in our desired direction and price is still moving upward.

Now you can see price is still in our desired direction and moving upward as 3rd candle is also in upward trend.
I here gives you target price and stop loss levels for this trade. I put stop loss levels as previous swing low.
In the bottom part as you can see trades details we are making a profit of $70 at these levels.
Note :
Don't be gready and always strictly follow your Target level and Stop Loss levels.
Question : 5
Through a Demo account, perform the (buy/sell) through Gaps levels. Explain the procedure (Required Screenshots).
Answer :
Here, I will show you how to make trade using the gaps that we learn in this lecture.
I here using BTCUSDT asset for that purpose.

As you can see in the picture market is an uptrend and a gap is created. This gap created is breaking the structure of market.
Using gap for trading, as the professor told in his lecture, always place trade at the lower level of next big candle in the new direction of trend.
I do follow same and place the trade at end of big candle in new trend. The trade details can be seen atvthe bottom of screen.
Once I initated my trade the price further goes down as you can see in the picture below:

Now as you can see in the picture above the red line show my entry level in the trade which is the end of big candle in new trend. You can also see the price further goes down.
Here in this trade I put stop loss just above the gap level which is also swing high and put target price in ratio 1:1 with stop loss.
Trade details can be seen in the bottom part of picture.
Note :
Always trade gaps carefully because they are risky to trade. Always trade with atleast 1:1 risk-reward ration and always follow target and stop loss levels.
Conclusion
This an great lecture by professor. We learn about many thing in the lecture. In this post we learn about resistance levels, support levels. We also learn about strong and weak levels. Basically strong levels are where price has already shown reversal many times and weak levels are those where price reversed at a maximum 2 times.
We also learn about Gaps and its different types. In last part of article we learn how to actually trade in the market with the help of Strong levels and Gaps. Using levels strategy is very simple and useful and when you learn how to apply this in real market then this is very helpful to you in your trading journey. We can also use some of indicator along with this strategy and as we already discussed how volume plays an important role in finding the gaps.
Thank you for reading my post till end. I hope you learn something from my post.
Hello @ Thank you for participating in Steemit Crypto Academy season 4 week 1.
Thank you professor @allbert for your feedback I will try to work on your suggestions.
Professor, I think I misplaced stop-loss level in picture 1 of question 4. I do accept it and apologize. For question 4 please refer to 3rd image of the question. I think I misplaced stop loss in picture one and I can correct it if you say . Enlight me if 3rd image is incorrect. Waiting for your response.
Your Post has been manually Supported/Up-voted by @steemingdiaries which is a Community & Curation account for Steeming Diaries Community.
Comments, Votes are performed an important role for Community, hence involved with your innovative Comments & Votes on other active users posts.
Community Latest Update: Steeming Diaries CONTEST Of The Month (September 2021) | Steemit FAQ
You have been upvoted by @sapwood, a Country Representative from INDIA. We are voting with the Steemit Community Curator @steemcurator07 account to support the newcomers coming into Steemit.
Engagement is essential to foster a sense of community. Therefore we would request our members to visit each other's posts and make insightful comments.
Thank you