Bichi Indicative Strategy- Steemit Crypto Academy- S5W6-Homework post for @utsavsaxena11.
Hello,
This is a homework post for professor @utsavsaxena11. In this post we will discuss about trading strategy known as Bichi Strategy.
.png)

Question : 1
Answer :
Introduction
Bichi strategy is a trading strategy that uses two indicators at a time to give signal. It consists of two indicators Bollinger Bands and Ichimoku Clouds. When we combine those two indicators we get signals for ours trades using this strategy.
We already discussed both these indicators in previous lectures in crypto academy. Both these are technical indicators and tells about the strength as well as momentum in the price of asset. To put it simply, Bollinger Bands Indicator tells about the support and resistance of the price level and Ichimoku Clouds tells about the movement in price of asset.
And when we combine both these indicators they work(gives signal for trade) in all kinds of trends and time frames and this is known as Bichi Strategy. The success rate of this strategy is approx 80% which is very good.
Identify Trends
As we all know about different trends like bullish trend, bearish trend, sideways trend. Here we discuss how to identify these trends using this Bichi Strategy. First, let us discuss how to identify uptrend using Bichi Strategy.
Uptrend
Uptrend is when the price of asset is moving in upward direction making new higher highs.
First we analyze the Bollinger Bands Indicator and see that where it provides resistance and support to the price of asset. Once we confirm that the Bollinger Bands Indicator provides resistance/support to the price of asset. Now we have to wait for the breakout of Ichimoku Clouds in an up upward move.
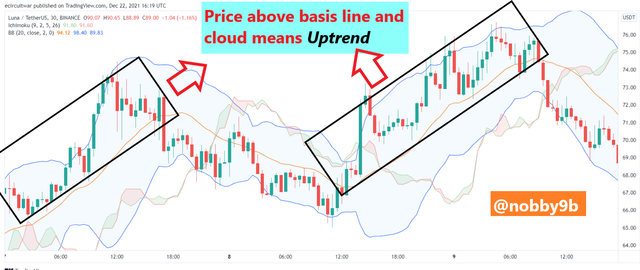
Once the price breaks Ichimoku Cloud in upward move the basis line of Bollinger Bands Indicator works as a support level for the price of asset and we can confirm that an uptrend is started.
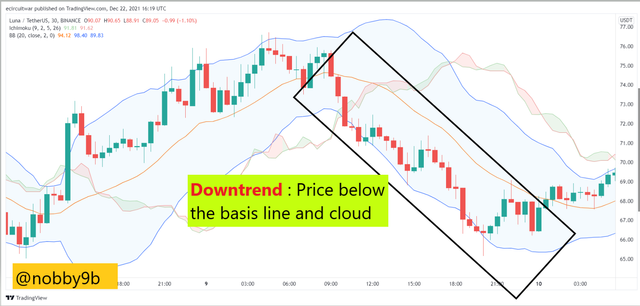
Downtrend
Downtrend is when the price of asset moves in downward direction making lower lows.
First we identify the resistance and support levels for asset using the Bollinger Bands Indicator and once we find the correct level. Now we have to wait for the price of asset to break the Ichimoku Cloud in an downward move. Once the price breaks this cloud in downward direction we can Say that downward trend is starting.
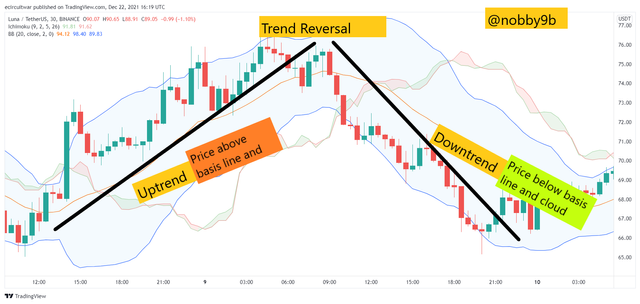
Identify Trend Reversals
TreNd reversal is the situation when the price of asset changes its direction means when price changes from uptrend to downtrend and similarly price changes from downtrend to uptrend these are known as price reversal. Price reversal are very helpful if you identify them at correct time.
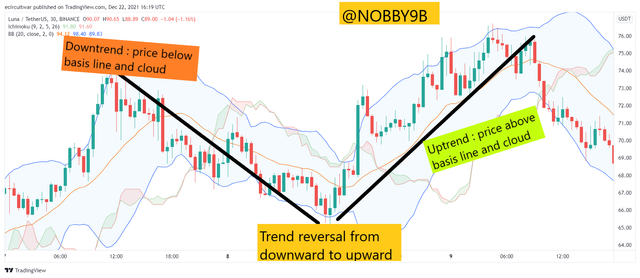
Downward trend reversal (price change from downtrend to uptrend)
To identify trend reversal from Bichi Strategy we use Bollinger Bands Indicator. When the Bollinger Bands and price movement are in downward move soon after this situation the price of asset moves in sideways trend. At this point prices breaks the Ichimoku Cloud several times.
Once we confirm both these conditions in price of asset we can confirm that trend reversal is expected to happen and price of asset changes soon after sideways trend.
For example -
Similarly, we can find the uptrend reversal using this strategy.
Buying and Selling using Bichi Strategy
Buying Trade
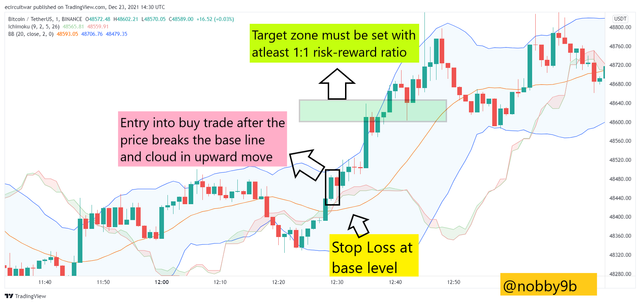
For a buy-side trade we first have to find a uptrend and once we identify an uptrend we now see the Bollinger Bands Indicator and when the price of asset is above the basis line than the basis line works as the support for the price of asset.
Now we have to wait for the price of asset to break the Ichimoku Cloud in an upward move and once this happens we can take entry in a buy side trade.
We take entry in buy side trade on the candle just after the breakout of Ichimoku Cloud. We put stop loss level for our trade at the Support basis of Bollinger Bands Indicator. And according to the risk-reward ratio we place of target level for trade.
For example -
Sell trade using Bichi Strategy
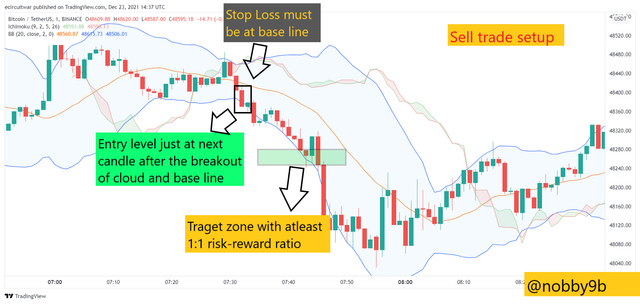
We place a sell side trade when the price of asset is in downward move. We identify the resistance level for the price of asset using the Bollinger Bands and when the price of asset is below the basis levels than this level works as the resistance for the price of asset.
Now we have to wait for the price of asset to break the Ichimoku Cloud in downward move and once this happen we take entry in sell trade at the next candle after price breaks the Ichimoku Cloud. We put our stop loss level as resistance basis of Bollinger Bands Indicator. According to risk-reward ratio we now put target level for our trade.
For example -
Demo Trade
Let us now look practically how to use this Bichi Strategy. Here, I will discuss about the buy side trade using the Bichi Strategy.
First, we need to identify an uptrend and once we identify that we now look at the Bollinger Band to find support level for the price.
Once we identify the support level which is the base line of Bollinger Bands indicator, we now have to wait for the price of asset to break these levels in upward move. Once the price breaks these levels in upward move now we look for the cloud breakout.
Once the price breaks the clouds and the baseline of indicator in upward move, we take an buy side trade entry at the next candle after breakout.
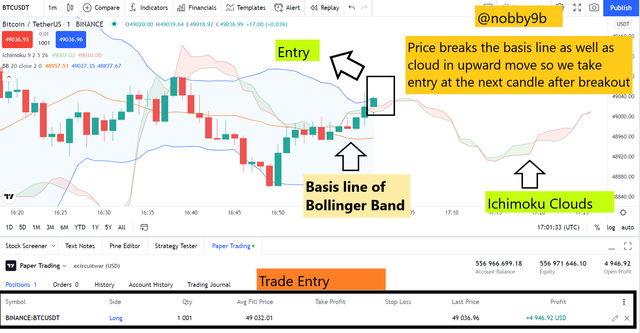
As you can see in the picture that the price of the asset breaks the baseline as well as the cloud in an upward move, it gives us a clear signal and we take entry at the next candle after the breakout. You can check my entry levels and trade details at the bottom of the screenshot.
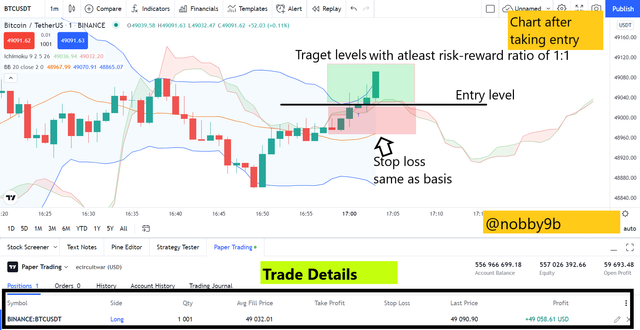
This is the picture after some time I took entry into the trade. In this trade we have to put stop loss levels as the baseline of the Bollinger bands indicator and the target levels should have at least a 1:1 risk-reward ratio with the stop loss level. In my trade, the risk reward ratio is higher than 1:1 which means it is a good trade to take.
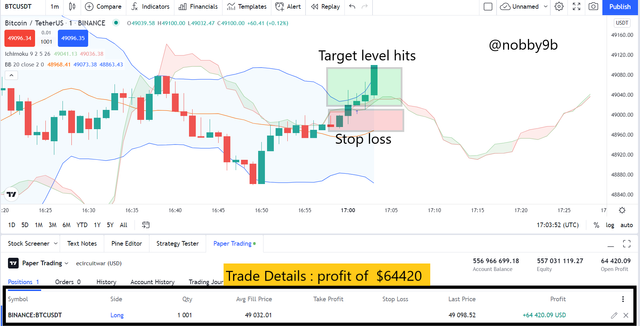
In the above picture, you can see that my target level for the trade is hit and I make a good profit in this trade.
In this way, we can use Bichi Strategy to make a trade in the real market.
Opinion
I used this strategy in some trade and found that its success rate is more than 85%, means this strategy has very good success rate.
We can use this strategy in a small time frame, as small as a 1-minute time frame.
This strategy helps short-time trades to make good profits.
This strategy is quite risky but it gives higher profits also.
We clear signals using this strategy that is why it is easy to use.
Question : 2
Answer :
Crypto IDX
Crypto IDX is a combination index for 4 cryptocurrency assets.Crypto IDX is an index made out of the average of 4 cryptocurrency prices.It consists of 4 cryptocurrency assets Bitcoin, Ethereum, Litecoin, Zcash.
Crypto IDX not only considers the price of asset but also the demand and supply of assets. This crypto IDX is an internal synthetic asset of Binomo platform which is not available at any other platform.
.png)
Crpyto IDX index is available on the Binomo trading platform. Calculation of crypto IDX is a complex thing to do so it is done with the help of software.
Binomo platform is available in approx 130+ countries and had more than 890k+ users. Using Crypto IDX in Binomo we can do prediction trading not spot trading. We have to predict the price of asset whether it goes upward or downward and if our prediction goes right we earn money. This platform is for full time traders who are trading from a long time it will be highly risky for beginners to do prediction trading.
ALT IDX
This is similar as crypto IDX, in this we have index of top alt coins. It is an index which consider 4 alt coins price for its calculation. It consists of Ripple, Litecoin, Monero and Ethereum.
.png)
Alt IDX is calculated using software and it not only consider the price of assets but also the demand and supply of the assets. Considering all these factors we calculate Alt IDX index.
ALT IDX index is available on the Binomo platform.And same as the crypto IDX index we cannot do spot trading in ALT IDX but we can do prediction trading in this index.
Benefits of trading IDX index
As it is very risky to do prediction trading but as the risk comes as comes the rewards. IDX index trading is quite popular because it has some benefits. Some. of the benefits are :
It is available 24 hours for trading, means you can trade at any time as you want.
It has higher profit margin approx 75-85% for each correct trade.
It is very suitable for short term trader and it is very liquid and volatile, one can even draw a 5 second candle chart for IDXs.
Signal prediction trading
Signal prediction trading is quite different from spot trading in which we have to buy and hold and asset in our wallet and then sold it at higher price to make profit. But, in signal prediction trading, we did not hold or buy any asset, we just have to predict whether the price of asset goes. upward/downward during a specific time period and if our prediction goes right we make good profit of approx 75%.
Legal or Illegal
Website Link : Binomo
Crypto IDX which is an index of Binomo platform is legal in our country. Binomo is reliable and trustworthy platform used by short term traders to get some extra income using their trading and prediction skills.
Binomo or say Crypto IDX is legit platform in India and one can find many positive feedback and review of the platform on internet.
It is even regulated by International Financial Commission which gives proof of its services and it also has registered address for their offices that you can find on platform's website.
Binomo has also won awards like the FE and IAIR award for excellence in global financial markets.
Question : 3
Answer :
Penny Cryptocurrency
It is a digital coin that costs approx $1. These are very similar to larger coins or stocks just their price is lower because of that these are known as penny cryptocurrencies. There is a very big advantage of investing in potential penny currencies because they have a high potential to profit. Also, investing in penny crypto coins will help to diversify your portfolio.
My Own IDX
In the making of my IDX, I consider the following things :
Coin has good liquidity.
Circulating supply of at least 10 million.
Coin listed on some of the popular exchanges.
Should have an experienced team behind the coin.
After analyzing all these factors the 4 coins that I choose to be in my IDX are Ripple(XRP), Cardano(ADA), Stellar Lumens(XLM), VeChain(VET).
Let us discuss these coins :
1.Ripple(XRP) :
Everyone knows that Ripple is one of the most popular coins these days. It was launched in 2012 by Jed McCaleb and Ryan Fugger.
XRP is a coin with the help of which you can make an international transaction within seconds. XRP has gained popularity so soon that it outperformed the largest coin BTC in aspect of transaction speed. XRP processes approx 1500 transactions per second. It has good liquidity and it has been listed on all the popular exchanges.
2.Ravencoin(RVN)
This is another popular coin that is listed on approx all the platforms and has a very good liquidity level.
This coin has a very experienced team behind it and a very strong blockchain. It has a third-generation blockchain that works on scalability and interoperability, which the bigger challenges faced by major cryptocurrencies.
RVN is very similar to the BTC coin. Bruce Fenton, a professional in the finance sector is the father of this coin.
3.Stellar Lumens(XLM)
This platform mainly focuses on cross-border payments. It is one of the popular coins which has more than $530 million trading volume in just one day. It has also ranked 13 in the most valuable crypto coins.
It is maintained by the Stellar Development Foundation. This foundation is non-profit foundation started by Jed McCaleb in 2014.
XLM coins main aim is to become open financial system that would give access to all income levels for performing financial services at higher speed with low cost. Some of the major services that this coin offers include mobile money, mobile branches, remittances, micropayments, and many more.
4. VeChain(VET)
VeChain is a blockchain-based supply chain aims to mitigate real-world financial issues. This blockchain aims to solve problems related to supply chains management. This blockchain has two coins : VET, VTHO.
VET has a limited supply of approx 86 billion, where VTHO is given as staking reward for VET. It is one the famous penny crypto to buy today. It has good liquidity levels and it is listed on approx all popular platforms.
VeChain is backed by PwC and many other popular Fortune 500 companies like BMW China, H&M, ...etc.
Conclusion
In this post, we discuss the Bichi Strategy for trading. In this strategy, we use two indicators Bolllinger Bands and Ichimoku Clouds to find signals for trading. It is very good strategy with success rate of approx 80%.
Later, we also discuss about how to find trend reversals using this strategy and also discussed how to make trade using this strategy.
We also discuss Crypto IDX which is an index calculated from the 4 crypto coins and is found on the Binomo platform, we also discuss the ALT IDX which is calculated using top altcoins.
Thank you professor @utsavsaxena11 for this great homework task. I learned a lot from this task.