Homework | Beginner's Course | Trend and Trend Lines | Professor @lenonmc21
Homework
Define in your own words what is a "Trend" and trend lines..?
A trend is a change in trade that has been going on for generations in the commercial world. If there is a growth in trade it is considered as an increase in propensity and if trade is declining with losses it is considered as a decrease in propensity. Prices in the market are not fixed. Sometimes there is a maximum in prices and sometimes there is a minimum in prices. However if the trend is positive it is a reason for the improvement in trade. Then trend is our friend.
When market investors invest their money in the same direction there is a simple tendency. That is prices begin to move in one direction. Thus a line drawn to represent a specific direction of a trend is called a trend line. By looking at the trend lines traders can determine the direction and speed of market price levels.
what is their role in charts...?
The role of trends and trend lines in charts is to give traders an understanding of market price fluctuations. If there is a definite sequence of variations in the data over time then straight trend lines of draw are drawn. If there is an increase in the price it is represented as an increase in the sequence. The trend line is drawn as the sequence decreases in the event of a fall in price.
Thus the trend lines drawn to represent prices in each case vary from case to case. For example, if several data values increase or decrease the polynomial trend line is used to represent such price values.
In addition an increase in market price during a bullish trend indicates that the trend line appears to be moving upwards. Bullish always provides data on price increases. Bearish follows the opposite process. That is in a bearish trend a decline in the market price is represented by a pull down the trend lines.
Explain how to draw an uptrend line and a downtrend line (Show a screenshot of each).
Uptrend lines and downtrend lines are drawn on the candlestick charts. Here the tendency lines are almost always drawn as a straight line. There must be at least two data values to draw the trend lines.
Uptrend Line
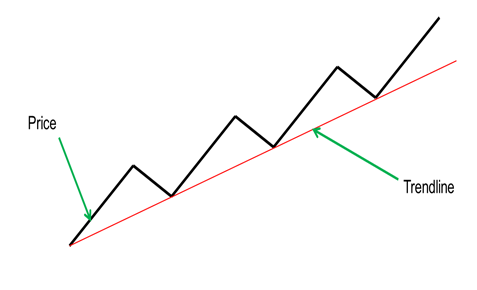
An uptrend line is drawn as an increase in sequence from low data values to high data values. Here a straight line is drawn from bottom to top. This has an upgrade. There has also been an overlap of prices with the trend line in some places. It can be clearly seen from the diagram above.
Downtrend Line
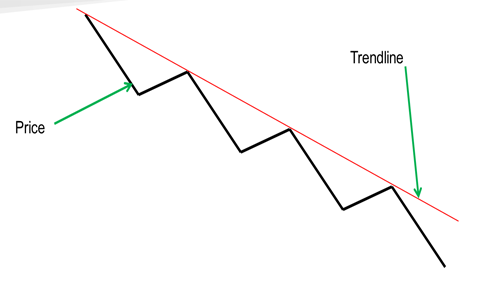
A downtrend line is drawn in the same way as an uptrend line is drawn. The main difference here is that it connects several higher data values on a lower slope and draws the trend line. Lines like these always present lower- lower and higher values.
Define in your own words what "Supports and Resistances are and how we can identify both zones (Show a screenshot of each one).
Supports
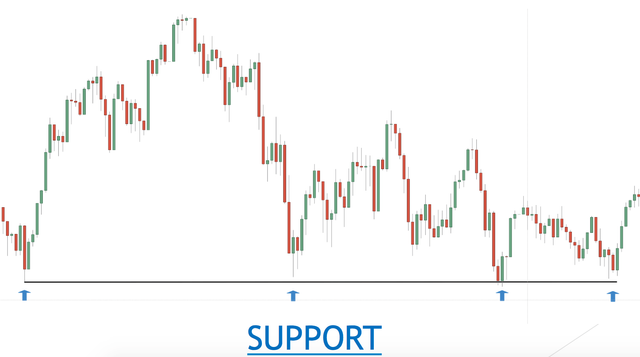
A support zone is a level that relates to price reactions that are considered to be the most important component of technical analysis. This represents a continuing rise or fall in prices in the region. When the support zone exceeds the relevant zoning limit it will no longer be a support. A support zone on a chart can be identified by the horizontal line drawn to indicate an increase or decrease in price over time.
Resistance
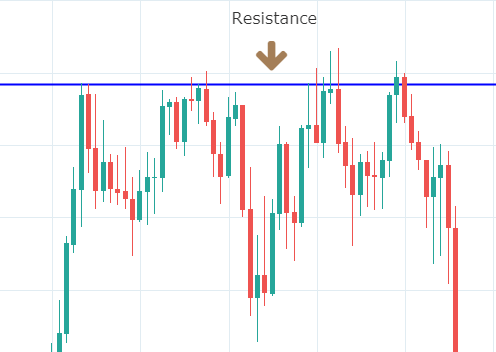
The resistance level is the area where the price stops preventing it from happening every time prices fly. This creates resistance to rising prices in the region. The main feature of identifying such a region is that it shows an increase rather than a fall in prices. It is also possible to identify supports and resistances by observing the price point on a chart.
Explain in your own words at least 2 simple chart patterns with screenshots.
Ascending Triangle
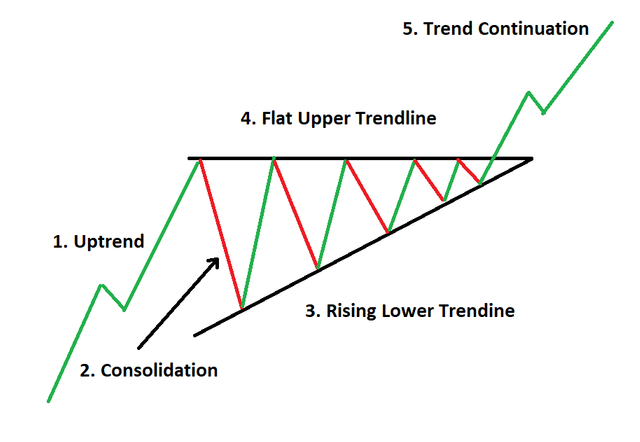
This is a simple graphic pattern. Most of these chart patterns are drawn to represent a slope between a resistance zone and a remaining price zone. Here the price points show an increase. The uptrend line is used to draw these charts.
Descending Triangle
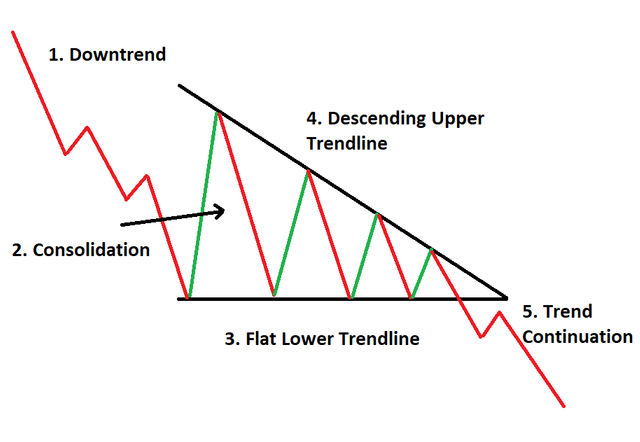
This triangular pattern is the inverted pattern of the ascending triangle pattern. As the word descending triangle implies such triangles can be identified by a setback. As shown in the figure its two lowest values form the bottom horizontal line of the triangle. The downtrend line is used for this.
Professor @lenonmc21's article was very helpful to me in completing this achievement. I wrote this article after studying it well.
Thanks for reading