Candlestick Patterns | Steemit Crypto Academy Season 4 | Homework Post for Task 10
Homework Tasks
1a) Explain the Japanese candlestick chart? (Original screenshot required).
b) In your own words, explain why the Japanese Candlestick chart is the most used in the financial market.
c) Describe a bullish and a bearish candle. Also, explain its anatomy. (Original screenshot required)
1️⃣ a) Explain the Japanese candlestick chart? (Original screenshot required).
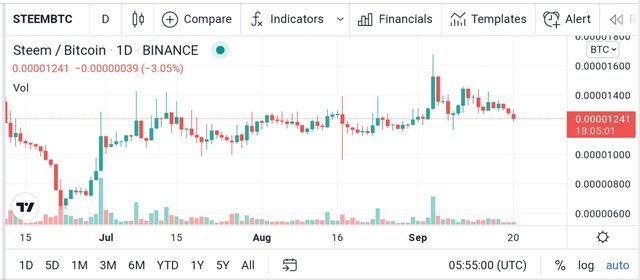
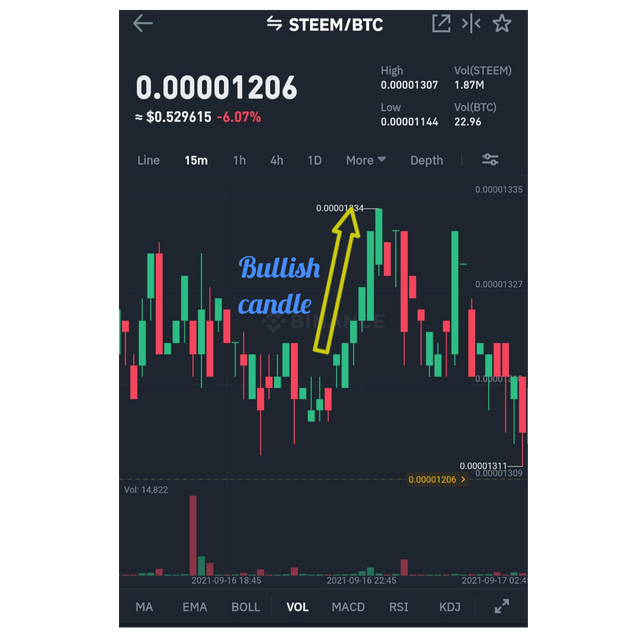
Example for candlestick chart - steem / bitcoin graph
Screenshot taken from tradingview.com
Before describing what a Japanese candlestick chart is, it is possible to get a better understanding of this by looking at instances where you have seen such a candlestick chart. I have seen this chart as an indication of price fluctuations on exchange platforms such as binance exchanges and trading pairs on tradingview.com. The screenshot above shows a candlestick chart indicating the price variation of steem / btc.
The shape of these charts is actually similar to the shape of a candle. So I think this is called a candlestick chart. The Japanese candlestick chart is one of the most widely used charts in the financial markets showing an asset price variance set by a Japanese rice trader in the 1700s. Traders who trade in crypto money can get clues about future price movements with the help of these candlestick charts. Usually a set of candles is made up of four parts as open price, highest price, lowest price and final price.
The candlestick is made up of interactions between buyers and sellers based on a particular asset. Crypto exchanges represent price movements that occur at different time frames in candlestick charts related to different trading pairs. Those time frames can range from as little as a minute to a day or more.
b) In your own words, explain why the Japanese Candlestick chart is the most used in the financial market.
I think the main reason why candlestick chart is used in the financial market is its ease of use. The Candlestick chart shows the difference between the price of an asset and can be used by cryptocurrency traders for financial gain.
A candlestick charts indicate the direction of the price of an item. This includes pricing openings and closures. In addition, it shows an increase or decrease in the price of an asset within a selected time frame so that traders can get clues about future price movements.
Japanese candlestick chart consists of green and red candles. Here the green color shows a positive price and the red color shows a negative price movement. Often red and green are used, sometimes white instead of green and black instead of red. As the candlestick chart comes in two colors, it will be helpful and convenient for traders to have a clear understanding of prices.
c) Describe a bullish and a bearish candle. Also, explain its anatomy. (Original screenshot required)
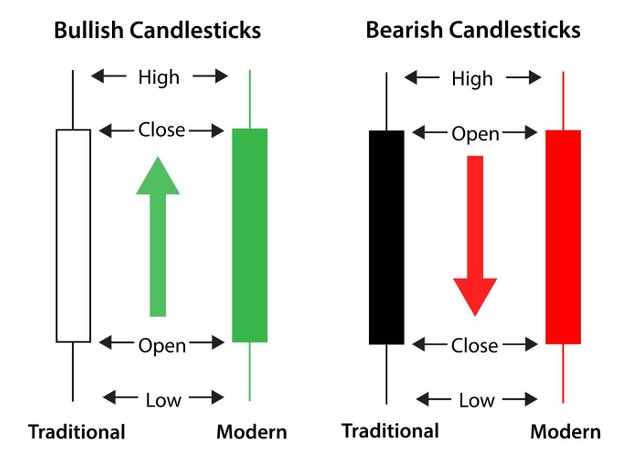
Source
The bearish candlestick is colored red, indicating a decrease in the price of an asset or commodity in the market. There are also patterns of using one or more candlesticks to represent data.
The anatomy of Bearish candles represents a fall in the price of a trade asset over a period of time. This decrease is proportional to the sequential decrease in the graph. The top of this bearish candle shows the open / high price of an asset and the bottom shows the close / low price of an asset.
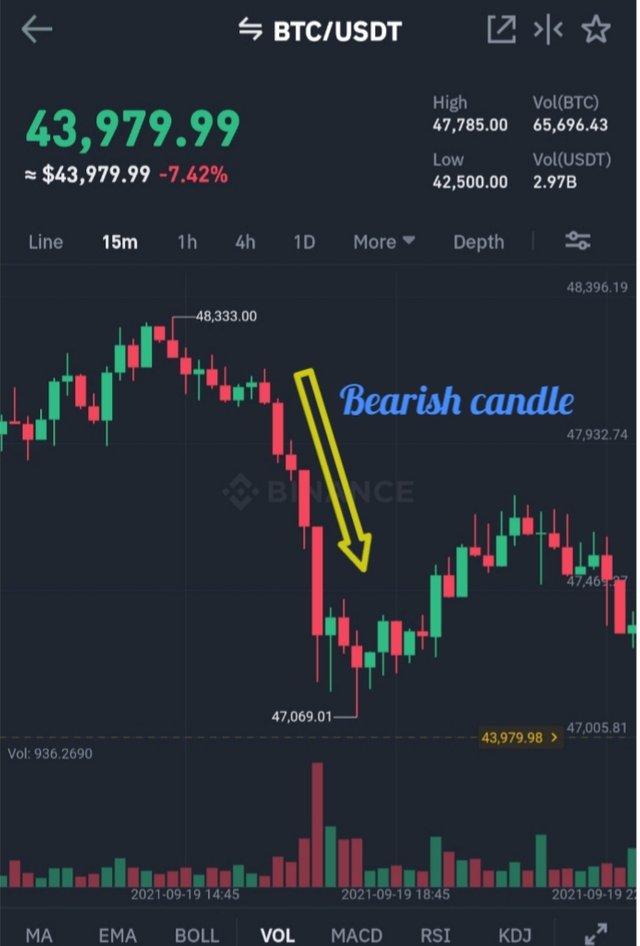
Screenshot taken from binance exchange
The anatomy of a bullish candle is the opposite of the structure of a bearish candle. Bullish Candlestick is painted green, indicating an increase in the price of an asset or product in the market. That is, a bullish candlestick can be used to identify economically advantageous opportunities.
The anatomy of Bullish candles represents an increase in the price of a trade asset over a period of time. This increase is also proportional to the sequential increase in the graph. These candles show the open / low price of an asset at the bottom and the close / high price of an asset at the top.
Screenshot taken from binance exchange
Professor @reminiscence01's article was very helpful to me in completing this achievement. I wrote this article after studying it well.
I am sorry, but what do you think about this?
https://copywritely.com/tools/copywritely/task/2093709
0.5% уникальности текста (uniqueness of the text)
Здравствуйте. Это полуавтоматическая проверка уникальности сервисом content-watch. Пожалуйста, сообщайте о неточностях. Уникальность вашей статьи согласно сервиса content-watch.ru равна: 0.5%
Hello. This is a half-automatic uniqueness check by the content-watch service Please report any inaccuracies The uniqueness of your stat th according to the content-watch.ru service is equal to: 0.5%