[Heikin-Ashi Trading Strategy]-Steemit Crypto Academy | S4W2 | Homework Post for @reddileep
.png)

1- Define Heikin-Ashi Technique in your own words.
In Japanese, Heikin means “average” and Ashi means “pace”. So together, Heikin Ashi means the “average pace of price”
Heikin Ashi gives room for traders to identify past price movements easily.
I feel the heikin ashi technique is most preferable when “in” a trade which will help you decide whether to remain in a trade or get out. the Heikin-Ashi candles represent the data of the previous candles. Meaning, it considers the values of the previous candles containing the open, close, high, and low prices of the previous candle.
Heikin Ashi allows traders to look for the sprout of new trends or the rewind of already existing trends. When the Heikin Ashi candle changes from red to green, it’s a sign that the price might be about to turn higher and vice versa.
DIFFERENCE BETWEEN THE TRADITIONAL CANDLESTICK AND THE HEIKIN-ASHI CHART
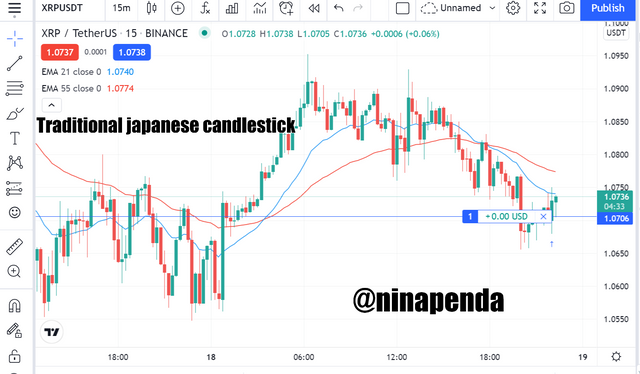
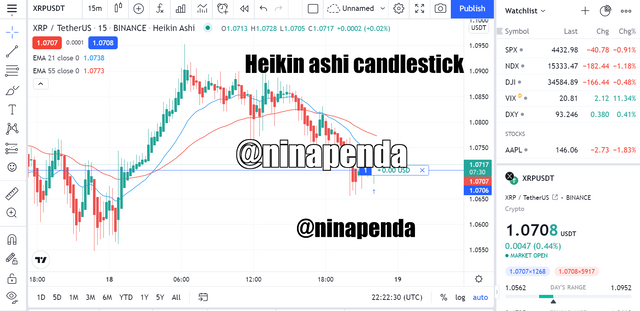
The first chart is the traditional Japanese candlestick chart, and the second chart is the Heikin-Ashi chart.
Candles on traditional Japanese candlestick charts can switch up real quick. They can change from green to red or red to green frequently making it more complex to interpret. However, candles on the Heikin-Ashi chart display more previous colored candles, helping traders to identify and analyze past price movements easily.
Candlesticks in the Heikin-Ashi chart are made by calculation while in the Japanese Candlestick chart the new candle starts where the previous candle closed
The Heikin-Ashi candlestick chart market trend can easily be identified unlike the Japanese candlestick chart market trend
In the Heikin-Ashi candlestick chart, the color of candles changes only when there is a change in the clear market trend while in the
Japanese candlestick chart the slightest market change can change the color of candles
3- Explain the Heikin-Ashi Formula. (In addition to simply stating the formula, you should provide a clear explanation about the calculation)
Heikin-Ashi uses 4 types of data to create candlesticks in a chart as mentioned before.
• Open
• Close
• High
• Low
HOW TO CALCULATE THE OPEN
In this case, the opening of the previous candle and the Close of the previous candle are added up and divided by two. It is explained in the formula below
(open of previous candle + close of the previous candle)/ 2
HOW TO CALCULATE THE CLOSE
The open, close, high, and low points of the candle are summed up and divided by four as seen below.
(open+ close+ high+ low)/4
HOW TO CALCULATE THE HIGH
High is the same as the maximum value of the high, open, or close of the candle. The formula can be seen below.
High = The maximum value of high, open, or close of the current candle
HOW TO CALCULATE THE LOW
Low can be seen as the minimum value of the high, open, or close of the candle
4- Graphically explain trends and buying opportunities through Heikin-Ashi Candles. (Screenshots required)
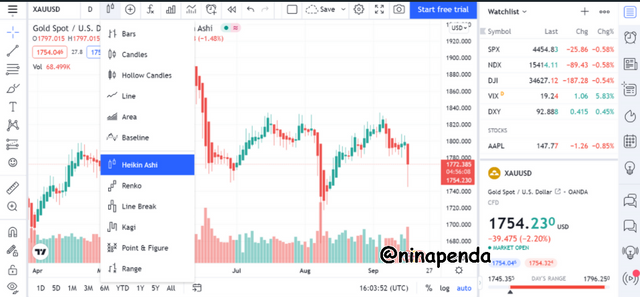
I'm using https://www.tradingview.com as a platform to demonstrate how to use the Heikin-Ashi candles in a chart.
Firstly, click on the candles icon on the top tool panel.
. Select Heikin-Ashi from the popup list. as seen below
![Opera Snapshot_2021-09-16_170351_www.tradingview.com.png]
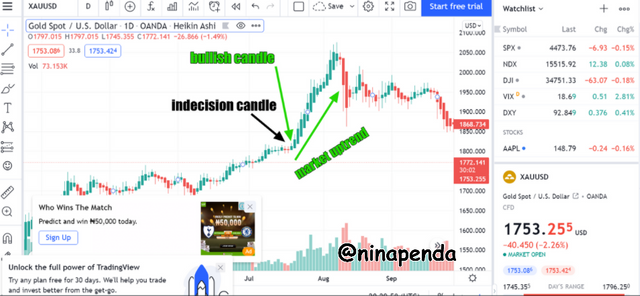
looking closely at the Heikin-Ashi chart below we can observe some features, the strong bullish candle, strong bearish candle, and indecision candle. moreover, just an upper wick can be seen on the bullish candle and just a lower wick on the bearish candle and we can see both an upper and a lower wick on the indecision candle. this indecision candle always comes after a continuous uptrend or a continuous downtrend. this can mean that there will be a change in trend or pause.
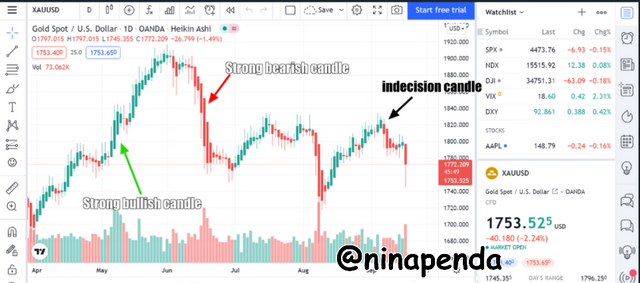
the candles with the wick above can be called the uptrend market while the ones with the wick below can be called the downtrend market. making progress, we can say that if the market moves indecisively and after that, a clear bullish candle opens at a level we can utilize it as a buy signal and if after an indecisive market decision is followed by a clear bearish candle we can regard it as a sell signal
5- Is it possible to transact only with signals received using the Heikin-Ashi Technique? Explain the reasons for your answer.
Yes, it is, however one should know that none of these indicators are 100 percent accurate as market behavior can change unexpectedly at any point in time. proper risk management should be involved while using the Heikin-Ashi candle. however, some indicators assist in securing your profit and in the usage of these Heikin-Ashi candles.
BY USING A DEMO ACCOUNT, PERFORM BOTH BUY AND SELL ORDERS USING HEIKIN-ASHI+ 55 EMA+21 EMA.
trades were taken by using the Heikin Ashi, the 21 EMA, the 55 EMA. below are the trade
I used https://www.tradingview.com/chart/gANx8fuJ/ as a platform to demonstrate it
SELL ORDER
I took a sell trade on xrpusdt after seeing the candlestick below the two emas and then after consolidation, with a clear bearish candle been formed, we took the trade as seen below
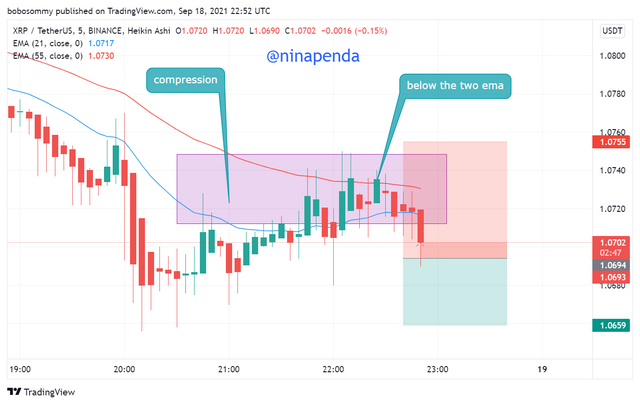
The trade is taken with stop loss above consolidation and a 1;1 r;r is used for risk management
BUY TRADE
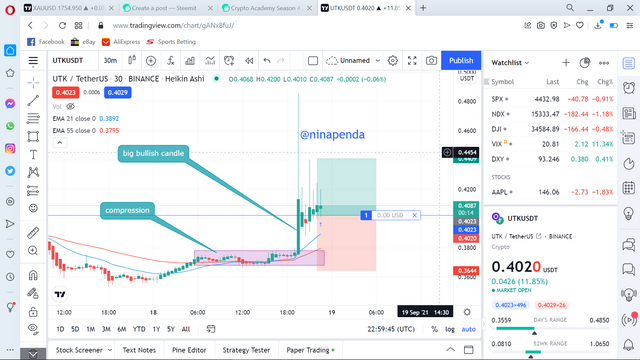
after identifying the indicator above the two ema and then we see consolidation and then we saw a bullish Heiken-ashi candle which confirms it and then we take a buy trade and then wait for the price to turn out.The trade is taken with stop loss below consolidation and a 1;1 r;r is used for risk management

Heiken ashi has been so easy for me, thank you Professor @reddileep for this opportunity. however, better results can be seen with additional indicators such as 21 EMA and 55 EMA as seen in this article but be warned that trading is risky and requires a lot of experience. hope you were able to understand from this post what heikin ashi trading technique is and how it is aided with indicators