Trading with Accumulation / Distribution (A/D) Indicator - Steemit Crypto Academy / S4W5- Homework Post for Professor @allbert
1- Explain in your own words what the A/D Indicator is and how and why it relates to volume. (Screenshots needed).
A/D INDICATOR
First of all before we talk about the terms, it is great to define what Accumulation and Distribution means so we can have a background knowledge of what we are talking about.
Accumulation is simply the gathering, build-up, assembling, amassing of data, content , items at a particular spot or place while Distribution is simply like the opposite of accumulation whereas accumulation deals with gathering , distribution deals with scattering, sharing, dispersal, placement of data, content, and items. In the crypto market, the term accumulation talks about the level of buying, whereas distribution talks about the level of selling
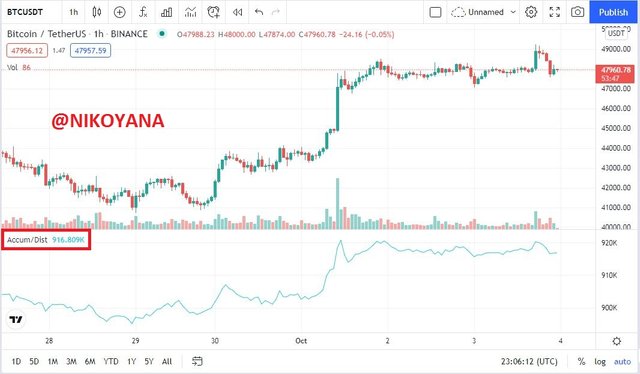
The A/D indicator is a volumed-based indicator created by Mark Chaikin it is an indicator that works with volume and price to determine whether an asset is in the accumulation stage or the distribution stage. it helps to detect when the price is going in the opposite direction causing a divergence between the stock and volume. so an increasing line of the indicator detects an upward trend while a decreasing line detects a downward trend.
how and why it relates to volume
when we talk of volume-based indicators, we talk of indicators with a mathematical approach and the A/D indicator is no different and the mathematical approach is represented on charts aiding the , the A/C indicator works in three different stages and the period volume is required in the determining of the asset flow volume. in summary, it uses the volume to determining the accumulation or buying stage and the distribution or selling stage of an asset giving entry and exit signals through the volume
ADVANTAGES AND DISADVANTAGES OF A/D INDICATOR
Advantages
- it is very simple to understand
- it helps in determining divergence on the chart
- Shows change in the trend either upwards or downwards
Disadvantages
- It takes time and might not be suitable for daily traders
- Doesn't give signals
- Not so reliable
2- Through some platforms, show the process of how to place the A/D Indicator (Screenshots needed).
its quite easy if you go through the few steps
click on www.tradingview.com
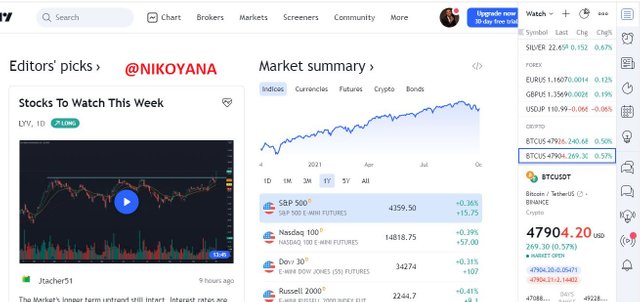 screenshot from tradingview
click on the fx button as you can see in the image below
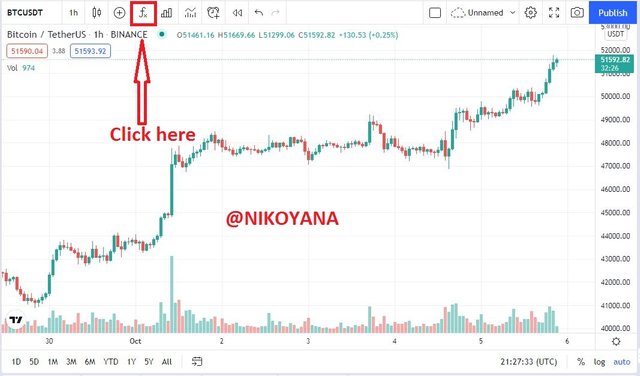 screenshot from tradingview
click on the search box and search ACCUMULATION and the indicator will surface
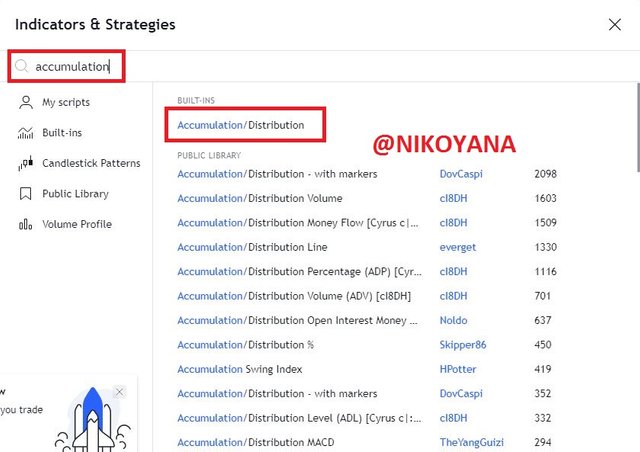 screenshot from tradingview
Below is the acc/dist indicator successfully added on the chart
 screenshot from tradingview
3- Explain through an example the formula of the A/D Indicator. (Originality will be taken into account).
first of all it will be important to take into account the formular of the A/D indicator
FORMULAR:
MFM = ((Close−Low)−(High−Close))/(High- Low)
where we have MFM as Money Flow Multiplier
we have Close as Closing Price
we have Low as low price of the period
we have High as high price of the period
MFV = MFM×Period Volume
A/D= Previous A/D + CMFV
CMFV = Current period money flow volume
having this parameters in mind lets go down to the example of the day
I will be using the chart of Bitcoin/TetherUs
 screenshot from tradingview
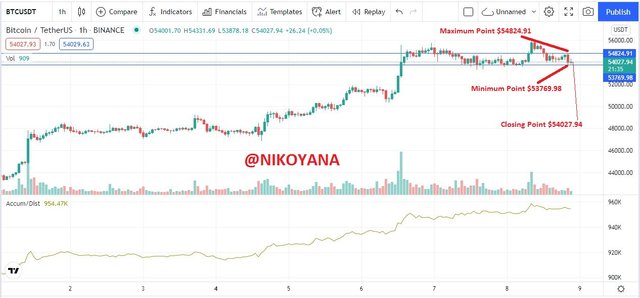
from the chart we have the
High = $54824.91
Low = $53769.98
Close = $54027.94
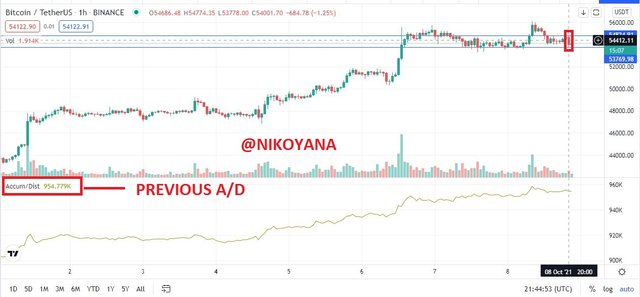 screenshot from tradingview
- Previous Accumulation/Distribution = 954779
- Current Volume = 909
MFM = ((Close−Low)−(High−Close))/(High- Low)
MFM = ((54027.94-53769.98)-(54824.91-54027.94))/(54824.91-53769.98)
MFM = ((257.96) - (796.97))/(1054.93)
MFM = (-539.01)/(1054.93)
MFM = -0.5109
- MFV = MFM×Period Volume
MFV = -0.5109 x 909
MFV = -464.408
A/D= Previous A/D + CMFV
A/D = 954779 + (-464.408)
A/D = 964314.592
4- How is it possible to detect and confirm a trend through the A/D indicator? (Screenshots needed)
Generally , there are two trends on the crypto market which is the bullish and the bearish trend. so I will be detecting the two trends using the A/D indicator
The A/D indicator is directly proportional to the price of the market. so therefore if the price is on an uptrend, the A/D indicator will be on an uptrend and if the price is on a downtrend, the A/D indicator will be on a downtrend
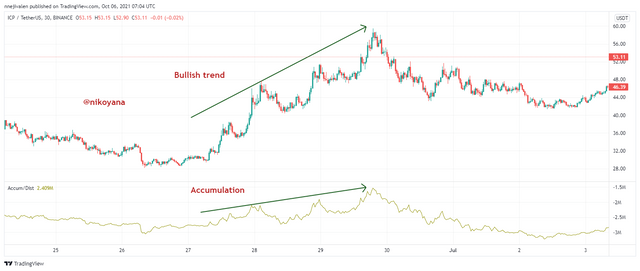
Bullish Trend
From the ICP/TetherUs chart below, we can see that the A/D indicator is on an uptrend corresponding with the price of the asset which signifies that the buyers are in control of the market and are trying to accumulate the asset
 screenshot from tradingview
Bullish Trend
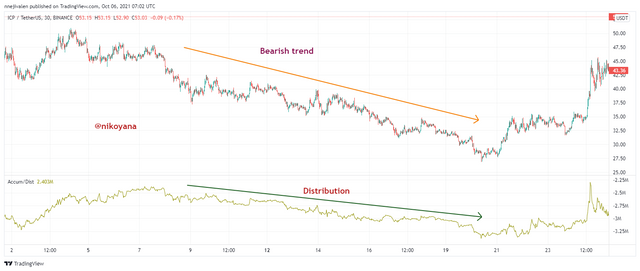
from the ICP/TetherUs chart below we can see that the A/D indicator is on a downtrend and the price is also on a downtrend which confirms that the trend is bearish, which signifies that the sellers are in control causing a distribution of the asset
 screenshot from tradingview
5- Through a DEMO account, perform one trading operation (BUY or SELL) using the A/D Indicator only. (Screenshots needed).
for this question I will be making a sell entry and exit
PROCEDURES I USED FOR A SELL ENTRY POSITION
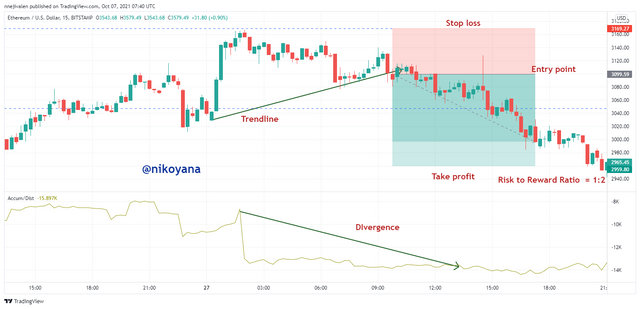
- I saw a divergence between the price and the A/D indicator, which entails that the price was an uptrend while the A/D indicator was on a downtrend
- I drew a trend line on the price and also on the A/D indicator
- I waited for the price to break the trend line
- As the price broke threw the trend, that was my entry for a sell.
PROCEDURE I USED FOR A SELL EXIT POSITION
- I Placed my stop loss on the closest higher high
- with a risk reward ratio of 1:2, I placed my take profit
 screenshot from tradingview
below is the result of the paper trading
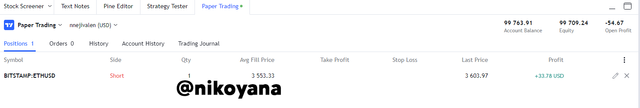 screenshot from tradingview
6- What other indicator can be used in conjunction with the A/D Indicator. Justify, explain and test. (Screenshots needed).
I discovered that the RSI indicator works as a good combination with the A/D indicator with the following criterias in place
To use the RSI to confirm an entry point
- The trend of the A/D and the price must be at a divergence
- if the RSI is on an oversold level, and the price is making a bearish trend and the A/D is also making a bullish trend that is a clear indication for a buy.
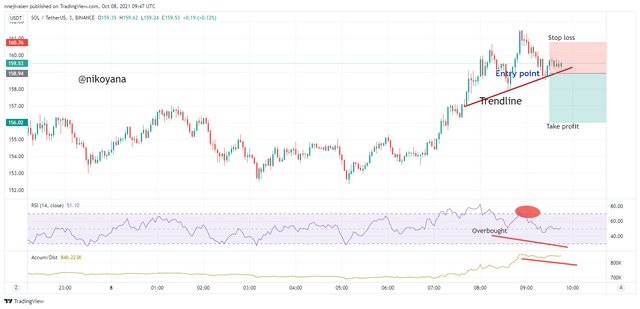
- Also if the price should be in a bullish trend then the RSI with an overbought indication will be heading downward and the A/D indicator is also moving downward that is a clear indication for a buy as we can see below in the chart
- As soon as the price will broke the trend-line on the market I executed a short sell
To use the RSI to confirm an Exit point
- With the recent higher high on the market that forms a resistance, I placed my stop-loss on it
- Using a risk to reward ratio of 1:2, I placed my take profit
 screenshot from tradingview
below is the paper trading on the SOL/USDT chart using the criterias listed above
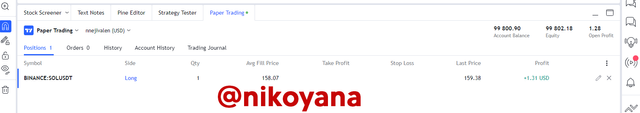 screenshot from tradingview
CONCLUSION
The A/D indicator, is a volume based indicator and is a very great indicator in the technical analysis field, I was glad that I was able to learn the mathematical calculations related to the A/D indicator and also make demo trades using the A/D indicator.
the A/D indicator is also compactible with a few other indicators one of which is the RSI and I was able to combine the both of them to initiate a trade. thank you all for reading my post.
best regards
@allbert