Trading Strategy with Median Indicator - Steemit Crypto Academy |S6W4| - Homework Post for Professor @abdu.navi03
hello guys, welcome to week 4 and I am excited to be here to be learning with my friends. today we are talking about an interesting topic captioned the median indicator. let's read and learn.
.jpg)

The Median indicator is a trend-based technical indicator that indicates the direction of the price of an asset and the corresponding volatility. This is done by looking at the ATR value, the middle value of the range within a specified period, and parallel bands made from the average true range value.
The median indicator is just the average of a number of peaks and valleys. Either the peak highs or the peaks lows are averaged and compared to an EMA. If they're different, you'll get an indication of which trend is occurring.
The indicator has two colors: green and pink/purple. The green indicates a buy signal, while the pink or purple indicates a sell signal. It is advisable to combine other tools with the indicator to increase efficiency.
When the median value of a chart is higher than the moving average it's a good sign to see green, which means that there are more buyers in control. When the median equals the moving average, that means that there are equal amounts of buyers and sellers, which means it's time to be careful.
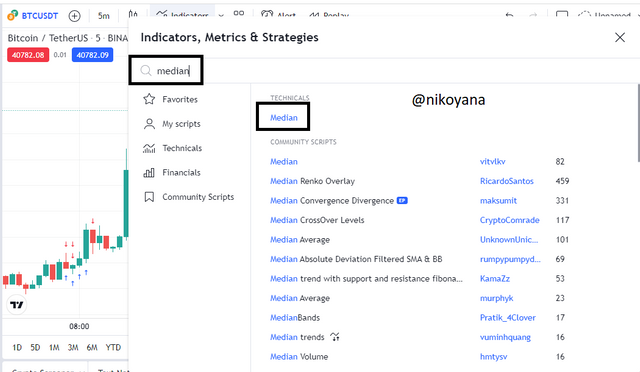
I will show you how to add the indicator in the chart. Once you have opened the chart on tradingview, look for an icon at the top called "indicator fx."
search for the median on the search button as we can see below and click on the indicator highlighted below
- After adding the indicator, it is expected to know how to set the indicator to suit each traders pattern.
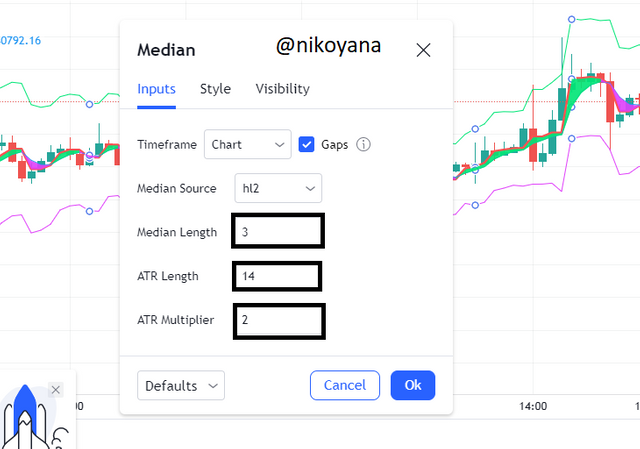
Click on the setting on the indicator, and you can see the setting as displayed above where we can see the median length, ATR length, ATR multiplier which has default numbers 3, 14 and 2 respectively
We could also adjust the style which has to do with the different colors and also the parameters of the median indicator from the settings.
HOW TO CALCULATE THE MEDIAN INDICATOR
THE MEDIAN = (HIGHEST PRICE + LOWEST PRICE)/2
EMA Value = (Closing price x multiplier) + (EMA [previous day] x [1-multiplier])
Median indicator = (ATR %change) [median value, EMA value]
Upper band = Median length + [2ATR]
Lower band = Median length - [2ATR]
from the formulas above, we can calculate the median indicator easily. When the EMA value is higher than the median average, a purple cloud form and it is indicative of a bear trend and when the median average becomes higher than that EMA value, then green bull clouds form and it becomes indicative of a bull trend.
With the median indicator, you can identify trading opportunities by paying attention to the color of cloud formed by evaluation of the EMA and median values. When the indicators are green and the market is up, it means that there are many buyers than sellers in control at that time and the trend of the market is on the bullish trend.
Traders and investors use the colorations on the chart to determine buying opportunities, so when a green cloud cross over a price movement, this is generally considered a buying signal.
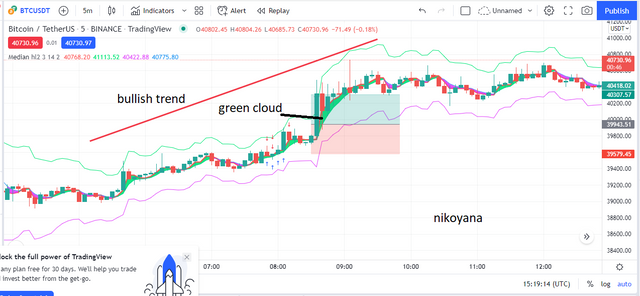
When a green cloud is present, prices are higher than at its last low point. Furthermore, when prices are above the green cloud, it is a sign of bullish trading direction and a buy signal. To do so, one should place their stoploss below the nearest low point in the purple cloud and take profit price targeting previous high points.
Just like we illustrated for the bullish movement in question 3, Likewise, It is possible to spot an opportunity to sell by looking at the colors in relation to each other. A bearish sentiment will result in a purple coloration with the EMA value being higher than the median value.
The appearance of purple clouds in the market suggests a potential for the price to go down, and crossing below the cloud generally indicates a sell signal. This can be seen on the following chart:
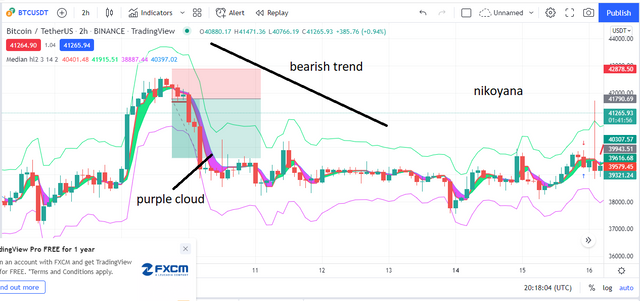
When a purple cloud is present, prices are lower than at its last high point. Furthermore, when prices are below the purple cloud, it is a sign of bearish trading direction and a sell signal. To do so, one should place their stoploss above the nearest high point in the purple cloud and take profit price targeting previous low points.
Combining the median indicator with other indicators makes it easy for traders to identify trends. Identifying trend using the median indicator all depends on the trader's ability to identify trends and combine multiple indications to build confluence in order to maximize trading opportunities.
According to the RSI indicator, there are two different market conditions: overbought or oversold. When a cross below 30 indicates an oversold condition, a bearish reversal is imminent. Similarly, when a cross above 70 indicates that the market is overbought, a bullish trend reversal is expected. But this signal could be false or distorted if there is disagreement in values of these two indicators.
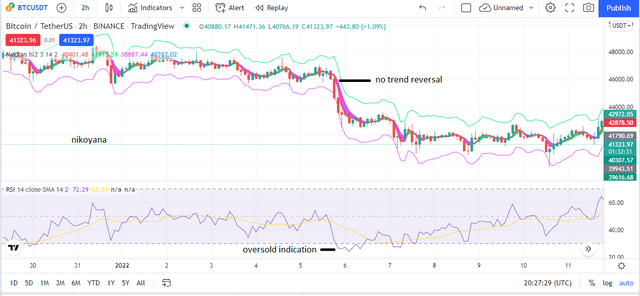
The RSI indicated an oversold condition, which is a possible bullish reversal signal. However, the median indicator showed that the purple cloud still has strength from sellers in the market, so traders could easily prevent making a wrong trading decision if they see a mismatch between signals from the tools.
Here I will be carrying out 2 trades which is for the buy and the sell entries let's start with the sell trade
SELL TRADE
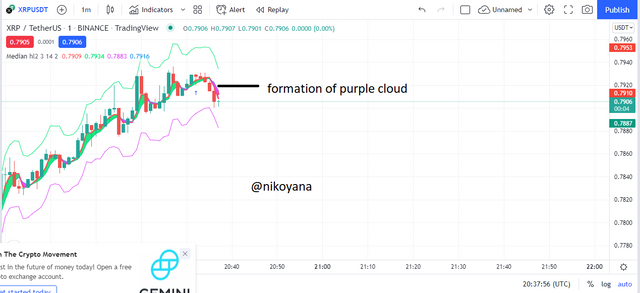
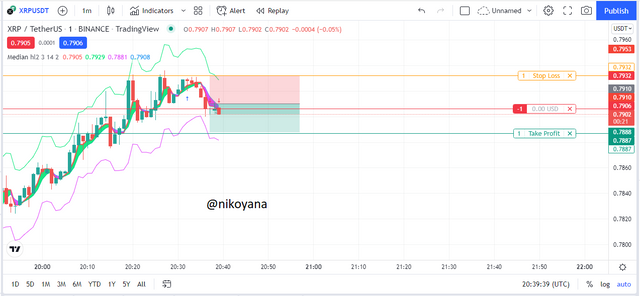
From the chart of XRP/USDT on a 1min time frame, we can see the initial formation of the purple cloud indicating an entry for a sell position signifying that the sellers are currently in charge of the asset at the moment
As soon as I saw the indication, I placed my stop loss and take profit at a 1: 1RRR and placed my trade immediately
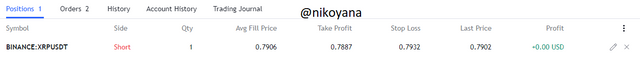
below are the details of the trade
BUY TRADE
From the chart of LINK/USDT on a 5 min time frame, we can see the initial formation of the green cloud indicating an entry for a buy position signifying that the buyers are currently in charge of the asset at the moment
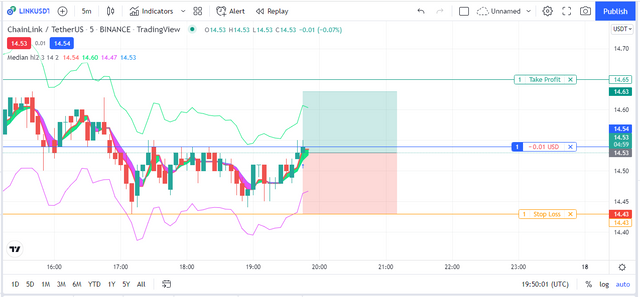
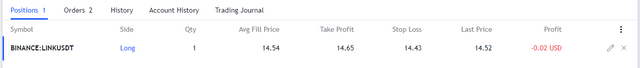
I placed my trade on a 1:1 RRR and initiated my trade, below is the details of the trade
With the potential for use in trading purposes, we analyzed the median indicator to demonstrate it’s usefulness as a trend-based signal that gives reliable signals to change from bullish to bearish, based on when purple overtakes green.
Indicators are not 100% accurate, so these need to be combined with other tools like the RSI. The median indicator allows you to filter out false signals from the market.
IMAGES REFERENCE TRADINGVIEW
AMAZING REGARDS
@abdu.navi03