Strategy and use of Donchian Channels - Crypto Academy / S5W1 - Homework post for @ lenonmc21

Explain and define in your own words what the Donchain Channels are?
There are so many definitions and explanations as regarding the donchain channel but I will try to explain it in the simplest and unique way so that everyone can understand.
The Donchain Channels are channels more like a a tunnel created by three lines of the moving average calculations, it is quite similar to the bollinger band as it helps us calculate the volatility of an asset, it helps us determine the probability of the overbought and oversold of an asset.
The three lines or bands are labelled after the upper band, the middle band and the lower band. the upper band helps to determine the highest price of an asset over a period of time. the lower bands represents the lowest point of asset over a period of time. and the middle is called the donchain channel
The donchain channels were discovered by Richard Donchian in the year 1950. Due to his desires to create an indicator to help determine volatility of an asset he was able to create the Donchain channel
ADVANTAGES OF DONCHAIN CHANNEL
- very easy to interpret
- very effective when used with other indicators
- great with different time frames
DISADVANTAGES OF DONCHAIN CHANNEL
- possibilities of having a falsified breakout
- Not so nice to use it alone
- needs a constant watching of the market
How to add the DONCHAIN CHANNEL indicator to a chart
adding the DC indicator to a chart is very easy to do
- Navigate to tradingview
- click on fx indicators
- click on inbuild and search the word DONCHAIN CHANNEL
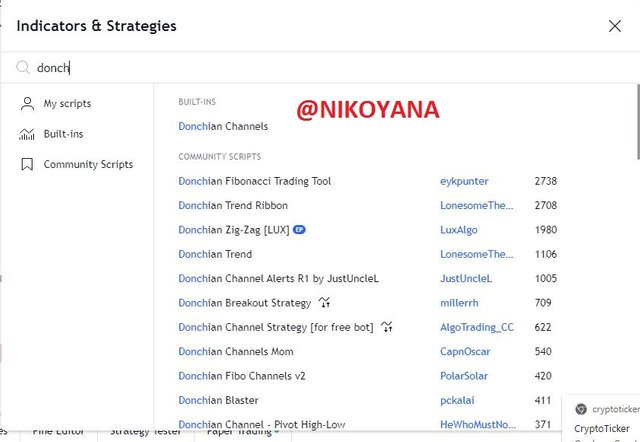
- then click on the indicator and play around withe the settings adjusting the periods to your preffered choice
Does it explain in detail how Donchian Channels are calculated (without copying and pasting from the internet)?
The Donchain Channel calculation are quite simple and understandable and I will be explaining it to the best of my understanding
Lower Band
In other to get this, we scale through the lowest low of each period.
and the value of the lowest low is taken
that is how we secure the value of the lower band
Higher Band
In other to get this, we scale through the highest high of each period.
and the value of the highest high is taken
that is how we secure the value of the higher band
Middle Band
after getting the Values of the Highest high and the lowest low
we get the average of the summation of the highest high and the lowest low
((HH) + (LL))/2
THE RESULT TURNS OUT TO BE OUR DC
Explain the different types of uses and interpretations of Donchian Channels (With examples of bullish and bearish trades)?
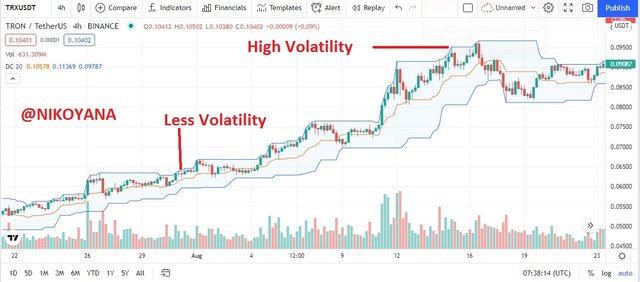
VOLATILITY
The use and interpretation of Donchain channels is quite straight forward and simple to understand. I will be explaining the use to determine volatility of an asset.
- when the distance between the highest high and the lowest low of a specific range of period is wide and reflected on the upper band and the lower band of the DC. the asset is said to be highly volatile.
- Likewise, when the distance between the highest high and the lowest low of a specific range of period is small and drawn close to themselves and reflects on the DC showing a small distance between the upper band and the lower band of the DC. then we say that the price of the asset is a less volatile and stable
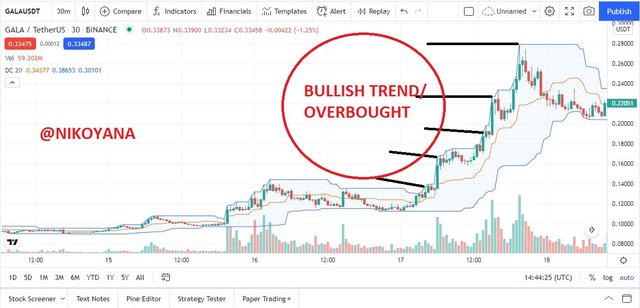
BULLISH TREND/OVERBOUGHT REVIEW
As we all know a bull in the crypto market tells that there is a rise in the price of an asset indicating that the buyers are in control when related to the law of demand and supply. using the Donchain channel to read and interpret the bullish trend is very simple and easy using these steps
- Go to the chart you wish to analyse
- input the DC indicator
- watch for areas where the price touches the upper band of the DC
- the fact that it touches the upper band doesn't exactly make it a bullish trend. there is usually a retracement and the continuation of the trend in an upward motion.
see chart below
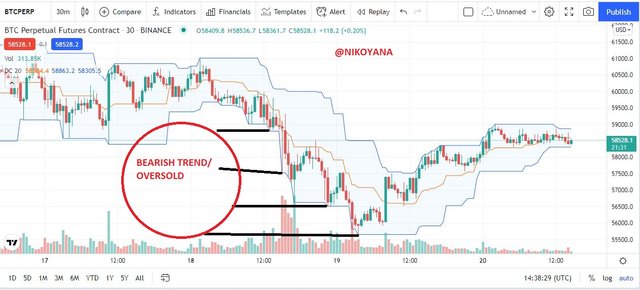
BEARISH TREND/OVERSOLD REVIEW
As we all know a bear in the crypto market tells that there is a fall in the price of an asset indicating that the sellers are in control when related to the law of demand and supply. using the Donchain channel to read and interpret the bearish trend is very simple and easy using these steps
- Go to the chart you wish to analyse
- input the DC indicator
- watch for areas where the price touches the lower band of the DC
- the fact that it touches the lower band doesn't exactly make it a bearish trend. there is usually a retracement and the continuation of the trend in an downward motion.
see chart below
Make 1 inning using the "Donchian Channel Breakout Strategy" and make 1 inning using the "Reversal and Retracement Strategy" . You must explain the step by step of how you analyzed to take your entry and make them into a demo account so I can evaluate how the operation was taken.
I will be doing this practical with two strategies being the breakout strategy and the reversal strategy.
REVERSAL STRATEGY
I always had the understanding that the price has to get to the lower band before we attempt a price reversal since the Donchain channel works on probability. but on the contrary our lecturer has taught us that the best way is to watch the price break through the middle band confirming that it is possible for a trend reversal, then we can place a stop loss at a 1:1 anticipating the reversal
let's look at the chart below for better explanation.
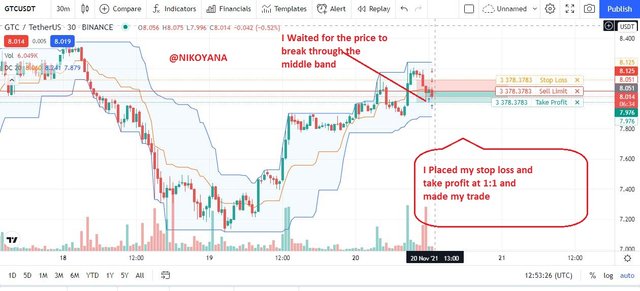
from the image above,
- I waited for the price to break the middle band indicating a possible reversal
- placed my stop loss/ reward ratio at 1:1
- then placed my trade
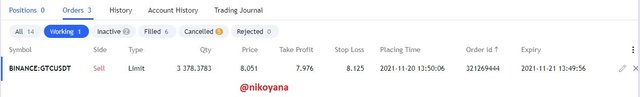
below is an active trade and as we can see, the trend has reversed in a bearish pattern
Breakout Strategy(Donchain channel)
The breakout strategy is not complicated and can be easily understood, we are going to be looking for higher highs that break though the upper band for an upward trend and lower lows that break through the lower band for a downward trend. let's see the screenshot below for better understanding.
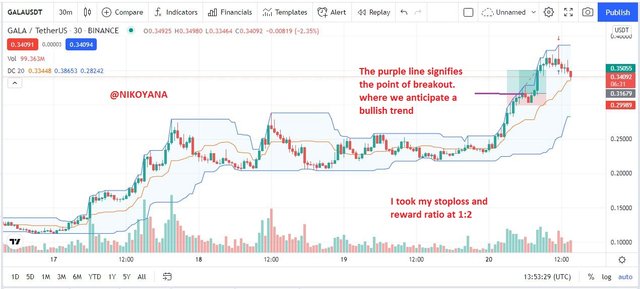
- from the chart above, I made observation waiting for the breakout to occur
- I set a stoploss to reward ratio at 1:2 making the take profit twice the stop-loss
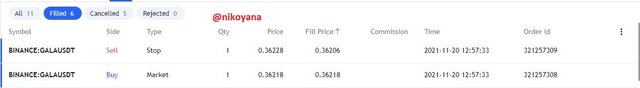
- the I placed my trade to buy and sell at my take profit
below is the trade
CONCLUSION
The Donchain is a very easy tool that was made to determine volatility of an asset and also check the probability of an overbought or an oversold of an asset. Although it is more efficient with the aid of another asset, it is still a very great tool as it's calculations are not too complex to understand.
All screenshots are gotten from tradingview and are used only for the purpose of this assignment posts
best regards
@lenonmc21
