Steemit CryptoAcademy Homework Post Season3- Week2 Introduction to Charts by @Nikoyana.
Good day steemians, and i welcome everyone to season 3 week 2 and a special greetings to our new professor @reminiscence01, i will be presenting on Introduction to chart.
1. Describe the Japanese Candlestick Chart? (Chart screenshot required).
.png)
The Japanese candlestick chart gives detailed information about the price movement within a specified time frame of an asset, Japanese candle stick charts enables traders to know the ups and downs of price movement of crypto assets which in turn enables them to take better trading decision regarding buying or selling of crypto assets.
In some charts these candles are been filled with red and green or white and black, the red and black means the price is going down and the green or white means price is going up.

2) Describe any other two types of charts? (screenshot is required).
LINE CHART
.png)
Line chart is a graphical representation of an asset that shows the changes in the price of the asset from time to time, here a line is drawn to represent the changes of the price of the crypto asset up until the closing price, also line chart makes head and shoulder more visible.
Line chart depicts only the changes in the price of an asset and does not show other detailed information of the asset such as open, high, and low prices of the crypto asset.
It is represented on a graph with periods from left to right along the x-axis and price levels from bottom till up along the y-axis.
HISTOGRAM/RANGE: is used to display the data of asset graphically in a bar chart format. The higher the bars the higher the outcome of a change and the lower the bar the lower the outcome of a change.
.png)
3) In your own words, explain why Japanese candlestick chart is mostly used by traders.
Japanese candlestick chart is mostly used by traders because it gives many information in one chart such as the open, high, low and close information of prices of an asset to traders in one chart as compared to others such as line chart which only gives information about the closing and change of price of the asset.
Moreover, with the filled color of the candles when a trader spots a continuous red or green candle he/she will know the trading decision to take and also is very simple and easy to use.
4) Describe a bullish candle and a bearish candle identifying its anatomy? (screenshot is required).
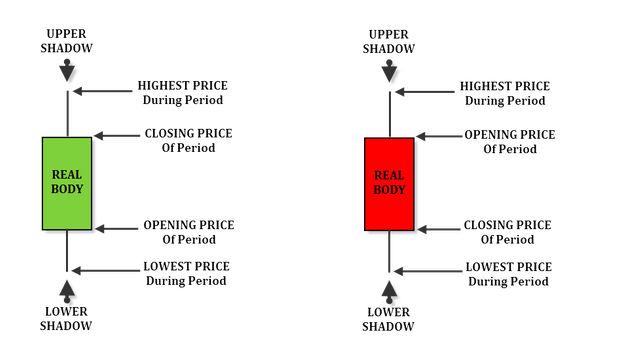
Bullish candle :is the candle whose close price is above its opening price which means the price moved from the opening price (which is down) to the closed price (which is up) which shows an increase in the price of the asset.
There is an uptrend with bullish candle that is more buyers are investing or buying at that particular time.
Bearish candle: is the candle whose open price is above the close price which means price moved from the open price (which is up) to closing price (which is down) which shows a decrease in the price of the asset. Here there is a downtrend because more of the underline assets are been sold.
Explanation of the anatomy
Body of the candles indicates the distance between the closing price and the opening price, the longer the body the higher the difference or changes in price and the shorter the body the smaller the difference or change in price. In the bullish candle that is the first diagram the price moved from the opening price to the closing price and in the bearish candle that is the second diagram the price moved from opening to closing price.
Conclusion
finally candlestick chart are very simple and easy to analyze and will be of great aid for beginners.
cc:
@steemitblog.
Hello @nikoyana, I’m glad you participated in the 2nd week of the Beginner’s class at the Steemit Crypto Academy. Your grades in this task are as follows:
Recommendation / Feedback:
Thank you for submitting your homework task.
@steemcurator02 my work has not been curated... thank you