Starting Crypto Trading - Steemit Crypto Academy |S6W1 - Homework Post for Professor @pelon53
It is great to be back to this long awaited center for the season 6 and this is the first week with interesting lectures and regulations to show equality. the lecture was beautifully delivered by professor @pelon53 and without wasting much time let's face the business for today


To start trading in the crypto market one needs to provide data of the cryptocurrency pair and the amount that one wants to trade with. Traders then utilize this information to predict the future prices of that cryptocurrency pair.
Fundamental analysis, also known as is a crucial ingredient in managing any kind of assets in the financial markets. Fundamental analysis focuses on economic events and other factors such as population, interest rates and standing decisions that affect supply and demands; it reveals what will happen in the future.
With experience, traders of crypto assets make more accurate decisions based on the fluctuations in supply and demand based off economic events. Nevertheless, when a trader lacks experience in interpreting these events, they most times rely on the financial news which occurs in conjunction to these events.
Fundamental analysis works differently in the crypto world. Fundamental events can affect future charts of an asset, but are difficult to find due to the lack of reliable data.
Cryptocurrency is an exciting and fast-moving industry. There are three major factors that can drastically change the market: Partnership with major brands, new exchange listings, and the burning of coins.
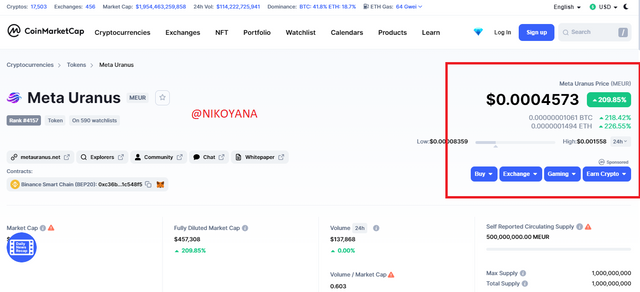
Look at the image below we can see that the meta uranus was listed 12 hours ago
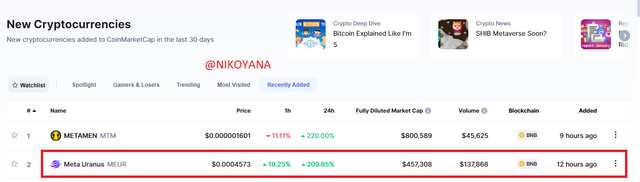
with a short time, we can see the percent increase pumped very high
Fundamental analysis is a valuable resource for traders, providing insights on trade strengths and exposing possible issues. For one thing, fundamental analysis helps traders stay up-to-date with the market so they can plan future trades. When progress in the market is threatened by short-term exchanges such as panic attacks and cryptocurrency price fluctuations, fundamental analysis provides traders with an umbrella to take comfort in. One piece of advice: don't just rely on fundamental analysis alone - it doesn't show key information about the economics and psychology of the market.
Technical analysis focuses on the psychology of traders on all aspects of their trades. Unlike fundament analysis, which is more akin to events and process leads on an asset, technical analysts rely on historical price data points on the asset. The idea of technical analysis is that price moves repetitively and knowing what patterns to expect in past data points will allow you to predict future prices.
New traders typically lack the expertise and skills needed to utilize technical analysis for market trading. For instance the goal is to analyze x, y and z data points and find opportunities and trends that will work in their favor.
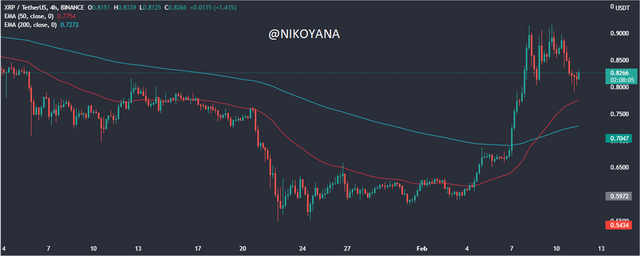
from the chart above, we can see the japanese candle stick and the exponential moving average of 50 and 200 respectively on the chart. this can be used to identify the next movement of the price action of the asset be it a bull or a bear. traders can take advantage of this, as this is an example of a technical anlysis.
Most traders use technical trading strategy as it helps them to find key price information before making any trading decisions. Similarly, technical analysis can help traders in making good trading decisions by determining breakdown points for profitable entries and stop loss levels with cuts on losses for protection against unfavorable trades.
Technical analysis is different from fundamental analysis in that it doesn’t necessarily require the analyst to have a detailed understanding of an economy, management, or market share. Rather, their predictions are made through interpreting changes in price levels and trading volumes.
Understanding the difference between fundamental and technical analytics is very important if one wishes to become an effective, successful investor. Fundamental analysis relies on diagnostic data whereas technical analysis relies on the propensity of natural momentum.
Fundamental analysis aids in making a long time investment while technical analysis aids in making trading decisions.
Fundamental analysis specializes on the quantitative and qualitative details of an asset whereas technical analysis is based on the volume, price action and the indicators
Fundamental analysis are used to check the value of a stock, asset or security using economic factors and other perimeters but technical analysis is used to check the price of a the stock, asset or security and forecast future price
It is important to note that the two different approaches are great individually but better off when a trader combines the two to generate the best data for his investment and trading.
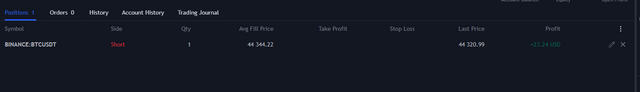
Starting crypto trading may require researching on the market and understanding the behavior of the market- such as which areas show major buying or selling points. Price is anticipated to be rejected at a certain level on the chart, so I placed a Sell Limit Order above the resistance and took profit nearby.
I gave indications of my support and resistance levels on the BTC/USDT chart on a 1hr time frame as soon as the price broke through the support getting to the resistance, I took my trade placing my stop loss above the resistance and my take profit at the closest support.
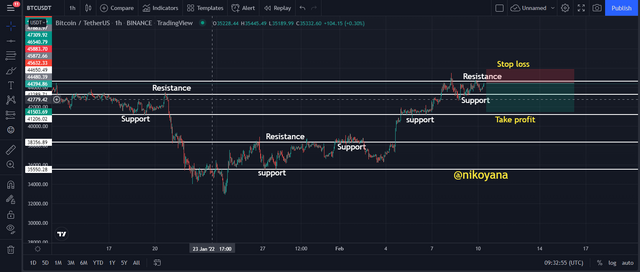
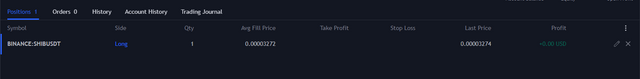
here are the details of the trade as we can see below confirming the procedure
In our next section, we will be analysing SHIB/USD using a 1 day timeframe on TradingView.com. For this analysis, we will position buy orders at a certain level and see how they might fare if executed in a live account.
Price eventually broke the resistance, which was high on supply and demand. A strong market buys pressure allows for a break of resistance without prices reversing and allowing continued bullish movements.
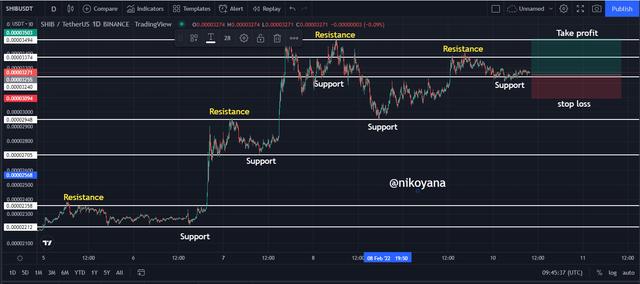
It's important to be careful while trading. A break of the resistance signals a strong bullish movement in the price of SHIB. I took a buy order with a stop loss placed below the broken resistance, and set my take profit at the nearest support . This is an example of how it will show on paper trading.
The formation of the candlestick chart patterns is determined by whether the crypto asset is in an upward or downward trend. When price falls below its opening price and begins to retrace, it creates a bearish-looking doji with a long lower shadow and a mostly clear upper shadow. in essence there is a drag between the demand and supply of the asset. using the candle stick pattern, we can determine trend reversals and trend continuations.
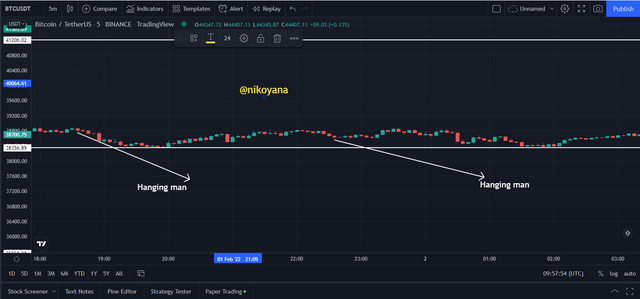
Understanding Hanging Man
The hanging man candlestick is one of the most important Japanese candlesticks and indicates a reversal. The pattern displays a long lower shadow and a short body and is formed with the open and close only slightly different with a long shadow. Taiwanese stock trader, Morison E.K. Simon points out that if you do see this pattern at the top of uptrend, it is time to take profits before pricing falls back to normal levels, as evidenced by JP Morgan.
Cryptocurrency trading is based on the psychology that when price opens, sellers pushed prices down and after some time, buying pressure enters the market to push prices back up and finally close near opening-level.
Hanging man signals a bearish reversal during an uptrend, and tells traders that the current trend is weakening and a possible reversal may occur at any point. Traders often take an entry after the formation of the hanging man to get in on a sell position when it appears at the top of wave patterns.
check out the chart below.
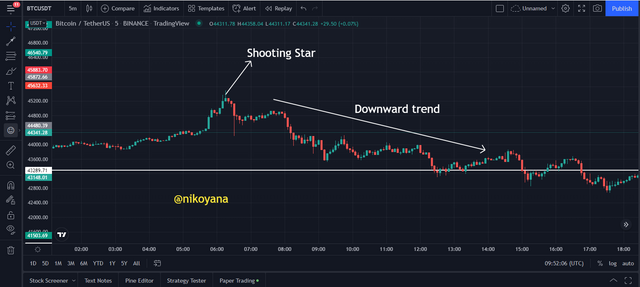
Understanding Shooting Star
A shooting star is a single body candlestick with a small body and long upper shadow. It's a strong bearish reversal when formed during an uptrend.
The candle opened with a bullish momentum supporting the price; then, the level of buying happened to push up. At some times, buyers were also not strong enough to sustain pushing for the bearish momentum again when there was again bearish pressure.
an example of shooting stars
However, these candlestick patterns work often in determining price reversals. If you combine them with other technical analysis tools, their efficiency is improved. Traders should be careful about confirming a bullish or bearish signal by combining both confirmation and contradiction where contradictory signals exist.
Trading in the cryptocurrency market requires some form of expertise and traders need to stay up-to-date on current tools and methods of analysis for good trading decisions. Technical and fundamental analyses play an important role in evaluating and predicting price movements and developing effective trading strategies.
Traders can combine patterns with other technical analysis tools to increase the efficiency of their trading system. Candlestick patterns are important for spotting price reversals in trading sessions, or market sentiments.
thank you @pelon53 for this splendid lecture
ALL UNSOURCED IMAGE REFERENCES TRADING VIEW
