Metric Indicators - Crypto Academy / S5W2 - Homework post for pelon53.
greetings to everyone who has made it this far, I am @nikoyana and I am glad that you are reading my homework post of the season 5 week 2 of this great academy.
below is my homework post written to the best of my understanding.


1.- Indicate the current value of the Puell Multiple Indicator of Bitcoin. Perform a technical analysis of the LTC using the Puell Multiple, show screenshots and indicate possible market entries and exits.
The puell multiple indicator is defined as an indicator that shows and ascertain the income of miners and helps determine the structure of the market. because of how complicated the mining of bitcoin can be, there is usually a high reward for the effort per block. currently for each block validated, miners would receive 6.25BTC.
There are usually times where the cost for mining is usually very high this can be determined by the puell multiple indicator, it also helps to determine good buy and sell positions as regard the mining cost being either large or small.
The puell multiple indicator has a formular which is used taking the ratio of the daily asset issuance in usd and 365 daily moving average of the asset in usd.

the current value of the Puell Multiple Indicator of Bitcoin is 1.404486 as we can see in the chart above.
Perform a technical analysis of the LTC using the Puell Multiple, show screenshots and indicate possible market entries and exits.
for this section, I will be using the website to perform this analysis Link. because it is my first time on the website, I have to create a standard account in order to get the analysis of LTC
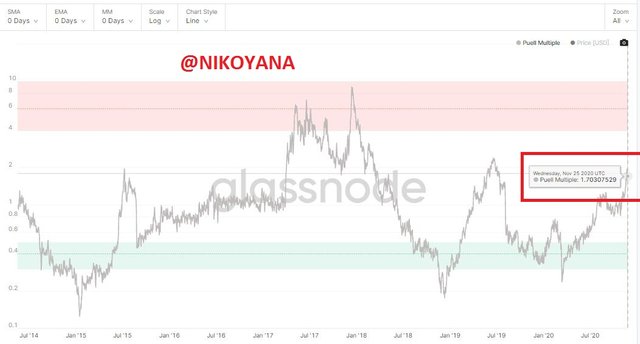
the current puell value for LTC is 1.70307520

from the chart, there are three(3) major interpretations that can be done
THE HIGH VALUES
The high values indicate that there may be a greater sell since the profitability of the miners is high compared to their yearly average.
THE LOW VALUES
The low values indicate that miners might sell some coins to cover up since the profitability of the miners is low.
THE HALVING
This is where the coin or asset issuance will be divided by 50%. I wouldn't go much into this as we will be revisiting it soonest
I will be analysing two points on the chart to indicate and explain a perfect buy and sell condition using the puell multiple indicator
.png)
Looking at the sell point as indicated above, that point was on tuesday 12/12/2017 at that point we had the puell multiple indicator as 7.77640959 at that point we can see that the profitability of miners is high and they can start selling to get there profits if they bought at a low price.
Looking at the buy point above, that point was on wednesday 01/01/2020 the puell multiple indicator was 0.38422325 at that point we can see the profitability of miners is low and it is a great buy signal. below is a confirmatory image indicating that the analysis was correct on the tradingview website for a buy signal on the LTC coin

Using the RSI indicator to confirm with the puell multiple indicator showing that on the 1st of January 2020 was a perfect buy signal for the RSI coin.
currently the the puell multiple indicator is in between and we really don't know where it will fall but we are hopefull it's for the best.
2.- Explain in your own words what Halving is, how important Halving is and what are the next reward values that miners will have. When would the last Halving be. Regarding Bitcoin
Just as I was saying about the halving earlier, the halving process in simple terms and to help us understand better is the halving of the reward of the miners into two and also halving the issuance of the bitcoin into two to help reduce inflation of the bitcoin.
after every 4years the reward given to the miners are divided into two, hopefully this will go on until 2140 and by then users will pay for the fees of their transaction to ensure that miners till have their incentives for their labour.
the maximum supply of bitcoin is estimated to be 21 million.as of 2009, the reward given for each block produced was 50BTC which was reduced after the first halving and the reward for miners reduced to 25BTC, and the second halving occured and we reduced to 12.5BTC and then the 3rd and current halving occured which reduced us to 6.25BTC in 11/05/2020.
To support the law of demand and supply which says the more scarce the commodity, the higher the price of the asset. in otherwords, the halving will help make the Bitcoin more valuable and increase it's price.
Next reward values that miners will have
| No. of Halving | Year | block no. | NEW BTC | MINERS REWARD |
|---|---|---|---|---|
| 1st halving | 2012 | 210,000 | 5,250,000 BTC | 25 BTC |
| 2nd halving | 2016 | 420,000 | 2,625,000 BTC | 12.5BTC |
| 3rd halving | 2020 | 630,000 | 1,312,500 BTC | 6.25 BTC |
| 4th halving | 2024 | 740,000 | 656,250 BTC | 3.125 BTC |
| Final Halving | 2140 | 6,930,000 | 0 | 0 |
The halving will continue until it finishes the maximum supply of 21million BTC and then there will be no more production of new BTC.
3.- Analyze the Hash Rate indicator, using Ethereum. Indicate the current value of the Hash Rate. Show screenshots.
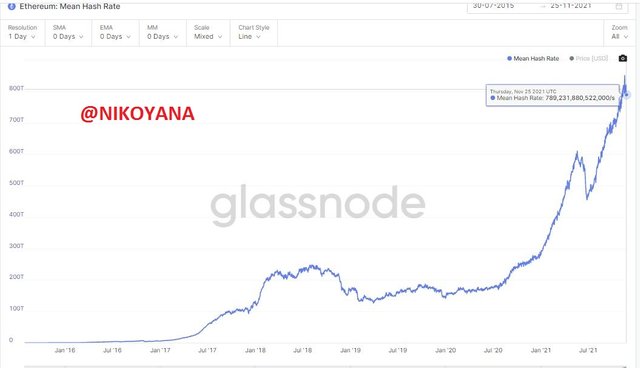
As we can see from the screenshot above, the current hash as at the moment of doing this homework post is indicated above as 789,231,880,522,000s
when we talk about hashrate we talk about the speed of the miners following to the ban of bitcoin and cryptocurrency in china we can see that the mining speed was reduced in the chart above which reduced the creation of ethereum blocks but currently we see the hash rate at a rise which I literally doubt will fall again. which have also cause an increase in the consistent rise in the price of ETH.
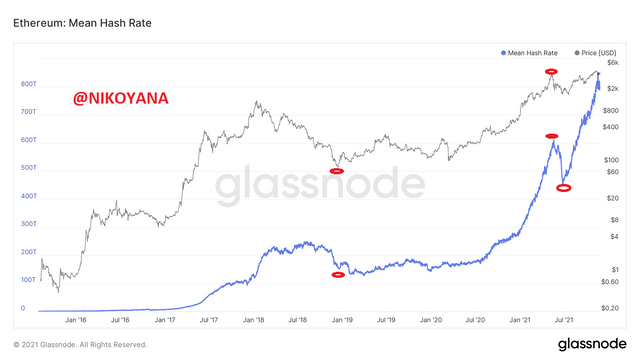
This analysis will cause investors to feel relaxed and stake on a long term with great hopes that the rise in the hash and the price will be on the rise hopefully approaching it's all time high.
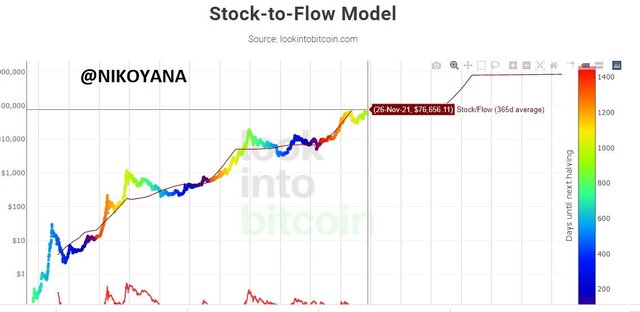
4.- Calculate the current Stock to flow model. Explain what should happen in the next Halving with the Stock to Flow. Calculate the Stock to flow model for that date, taking into account that the miners' reward is reduced by half. Show screenshots. Regarding Bitcoin.
the stock to flow model helps to determine new values change in asset and help determine if they are scarce or not. so we have great assets like gold, platinum, diamond, and bitcoin which are expensive assets and are short in supply. it is gotten by getting the current stock of the asset over the new flow of production.
A higher ratio would tell scarcity and a lower ratio would say otherwise.
SF= stock/flow
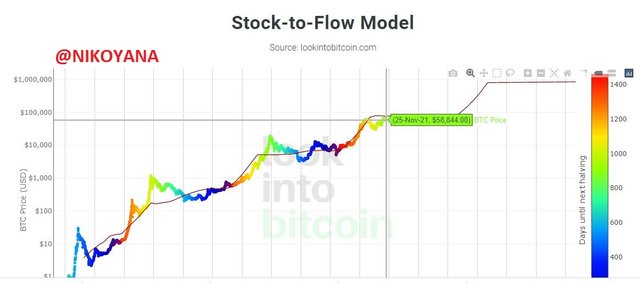
we know that after every 4years a halving occur that is why there is fluctuation in the chart above. the mining of new blocks occur every 10minutes and in the space of 4years there would be 210,000 blocks where the next halving will occur. each year there are 52,560 blocks.
currently, today we have 18,884,037.5 BTC in circulation
Flow(F) = Block reward * Block production per year.
Flow(F)= 6.25 BTC * 52,560 = 328,500
SF = 18,884,037.5/ 328,500
SF = 57.486
to get the current value of stock to flow model is
Stock to Flow = 0.4 x SF ^ 3
0.4 x 57.486 ^ 3 = 75,984.25 BTC
Explain what should happen in the next Halving with the Stock to Flow. Calculate the Stock to flow model for that date, taking into account that the miners' reward is reduced by half. Show screenshots. Regarding Bitcoin.
The next halving will be scheduled for 2024 after the last halving in 2020, the reward of miners will be divided into two from 6.25BTC to 3.125BTC. from the chart I gave in question 2 we can ascertain that 656,250BTC will be issued.
To that effect, I have 18,884,037.5BTC in circulation and I will be adding 656,250 BTC to it giving us a sum of 19,540,287.5 BTC. we will be using this new figure for my calculation.
Flow(F) = Block reward * Block production per year.
Flow(F)= 3.125 BTC * 52,560 = 164,250
SF = 19,540,287.5/ 164,250
SF = 118.967
to get the current value of stock to flow model is
Stock to Flow = 0.4 x SF ^ 3
0.4 x 118.967 ^ 3 = 673,502.98 BTC

CONCLUSION
The homework post is very interesting and easy to understand starting from the puell multiple indicator, down to the concept of the halving which really caught my attention because it was a totally new fact and knowledge to me knowing the amount of bitcoin estimated to be incirculation and the year that the supply will be exhausted.
Then I used the hash rate to analyse the etheruem determing the speed of the production of each block which another lovely fact. then I went down to the stock to flow indicator that took me through some series of calculations that refreshed my mathematical cells.
In all it was really an excellently delivered lecture and I have written to the best of my understanding.
cc
@pelon53