Introduction to the Principles of Crypto Analysis - Crypto Academy S4W7 - Homework Post for @imagen
Good day pals and professor of this great academy, I'm delighted to be part of this great assignment one more time and pleased that this time was a great lesson moment for me.
The lesson is centered on Crypto Analysis as we understand analysis to be the bedrock of crypto currency activities as they help in making of right decisions including the technical and fundamental analysis
My assignment is here below
 designed by me in photoshop
1.) What are the differences between Fundamental Analysis and Technical Analysis? Which one is used most often?
We know that there is cogent reason to study the basis of what venture we may want to go into and the crypto world is not out of the context, as before we can successfully buy, trade and sell with profits we must need to conduct analysis both fundamental and technical and make sure that the market behavior favours us.
Before I proceed to outline the difference between the fundamental and technical analysis, I wish to briefly talk on each of them.
The fundamental analysis as it's name implies is utmostly important in the market and can be seen as the harnessing of the market information of both in and outside factors to ascertain the inward value of a coin and comparing it with the actual value it's got in the market.
Now here is the catch, if it is ascertained from here that the intrinsic value isn't valued as what it is in the market, it's seen as fair or real and could be termed prospective. Here traders can buy and hold with great expectations of seeing a rise in value.
The Technical analysis on the other hand, could be seen rephrase as, "an art of charts".
It is because in this kind of analysis, the price movements aren't studied by information or research anymore but by the movement of the token/assets chart ,including its movement pattern and from here decisions could be made.
Here we consider several factors about the asset like :its price history, support and resistance levels, including several other chart factors which help in better analysis of the asset.
The price pattern used in the analysis too,is formed by the high, low, open and close positions of the assets over a time period.
The differences between Fundamental and Technical Analysis include that :
In fundamental analysis, the mission, is to evaluate the actual value of a stock by determining its intrinsic value while in a technical analysis, future prices /value are determined by the use of charts to understand price pattern and changes
Fundamental analysis involves intrinsic evaluations, because they are done mostly on long term investments while technical analysis deals with short term analysis and could be read from just price trends
Technical analysis studies simple parts of the market, like just when to buy or sell in the market while the fundamental analysis gets mainly to studying the intrinsic value of assets
Technical analysis is done via the information and data gotten from previous chart data ie past charts and trends while fundamental analysis demands both past and present information in conduction of analysis
2.) Choose one of the following crypto assets and perform a Fundamental Analysis indicating the objective of the Project, Financial Metrics and On-Chain Metrics.
For this work, I'll be choosing the Polkadot.
 source
The Polkadot could be seen as a future blockchain protocol that joins different unique blockchains into a particular system. The consensus mechanism on this protocol, is the Proof of Stake algorithm and was developed by Gavin woods one of the co-founders of Ethereum.
Features of Polkadot system :
The Polkadot aims to deliver some basic objectives and they include :
Governance :
The Polkadot system aims to give holders of the native token, control and dominance over the protocol making it different from other platforms in the sense that, certain privileges are meant to be enjoyed exclusively by miners but in this system, users of the relay chain, enjoy every privilege including handling and influencing system fixing or updates
Staking :
The Polkadot system also encourages NFT staking and rewards alloted to gamers who stake their tokens on the blockchain for playing. The system too abhors cheating as gamers who cheat, automatically lose their tokens staked on the platform
Bonding :
On the main relay chain,fresh parachains are added by a process known as bonding of tokens and parachains that are irrelevant /outused, are eliminated by bonded tokens.
Polkadot's road map :
Having the Polkadot's governance system activated , it can vote for the first Council and Technical Committee and begin to allow non-private proposals . Irrespective of the fact that for a few actions on the chains, the Sudo key would still be responsible but then parachains would own most of the actions and decisions to be made can. Immediately Sudo is replaced, root calls will only be sent and received only through Governance
Sequel to being allowed by Polkadot’s network governance, parachains will be checked and utilized both on the system's parachain testsystem and on Kusama(Note that Kusama is the first testing project of this Polkadot ecosystem) . On the code being completely experimented, checked and set, and parachains are operating easily on Kusama, Polkadot governance can start up parachains and startup parachain slot lease auctions, a project highly waited for by the system . Parachain slots will be auctioned one after another , with every auction remaining valid for about 7 days
Polkadot, is valued at $44.28 and its financial metrics as at the time of this homework include :
It's market cap, is at $46, 385,114, 513
Circulating supply 1, 979,214, 624
Total supply 1,123, 650,921
With its maximum supply not available
3.) Make a purchase from your verified account of at least 10 USD of the currency selected in the previous point. Describe the process. (Show Screenshots).
I will be making a purchase from my binance account exchanging my usdt for Polkadot coin
- log in to the binance account and click on market as you can see below
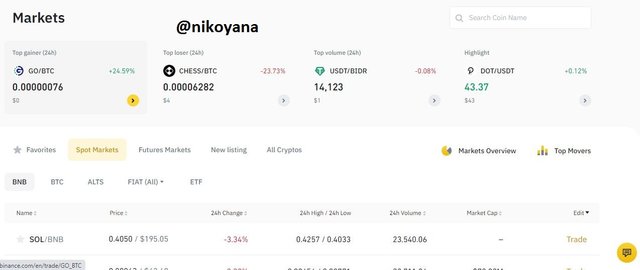
- search for the coin you wish to buy and click on it, you will be directed to a new page that show the chart as well as the order book
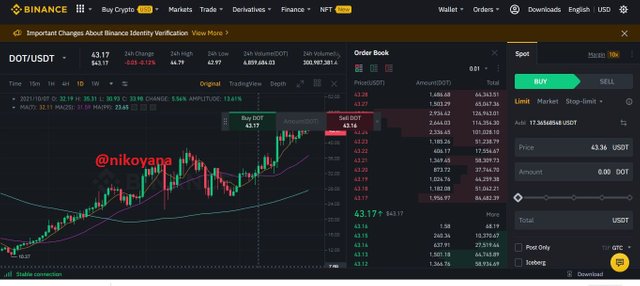
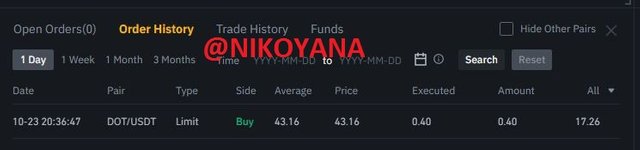
- I made a exchange of 17.264usdt for the dot coin as you can see below, then click on buy
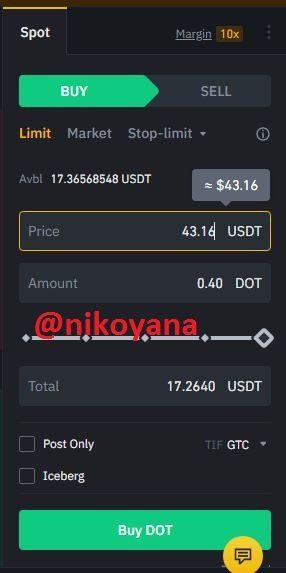
- below is my filled order of the purchase
4.) Apply Fibonacci retracements to the previously selected asset with a 4 hour time frame on the platform of your choice. Observe the evolution of the price at 24 and 48 hours, did it go up or down in value? Look to identify resistance and support levels. (Show Screenshots at 0, 24 and 48 hours of purchase where the date and time are observed).
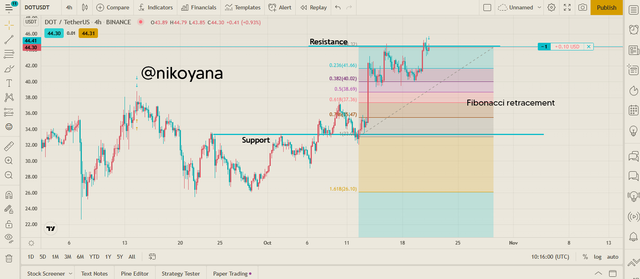
AT 0 HOUR
In a DOT/USDT chart on a 4hr time based I saw a support and a resistance on the trade then I entered the trade then I placed my fibonacci using the support and the resistance expecting the price to reverse since it has reached it's major support, so this my chart on the 0 hour
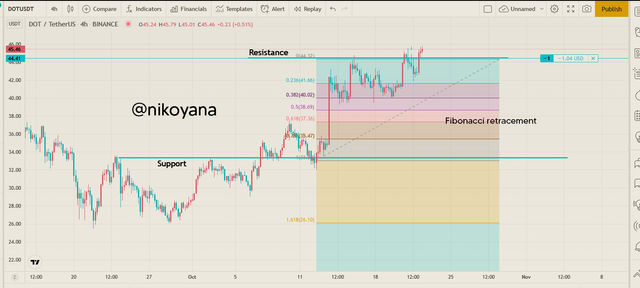
24 HOURS LATER
I observed that in the DOT/USDT there is no liquidity although I expected the price of the market to reverse but the rate at which it was moving was to slow even though it was on an upward trend. below is my chart for my 24hrs time frame
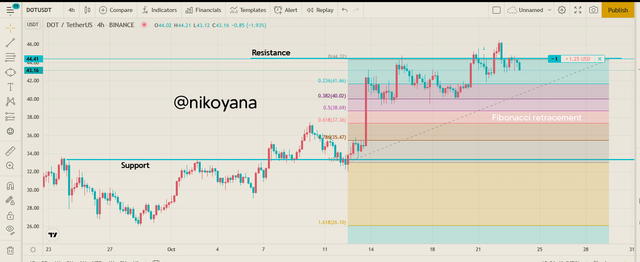
48 HOURS LATER
48hours later, I observed that the price was on an upward trend and I noticed it earlier, so below is my chart for the 48hours
5.) What are Bollinger Bands? How do they apply to Crypto Technical Analysis? With which other tool or indicator do you combine Bollinger Bands to analyze a Crypto? Justify your answer.
What are Bollinger Bands?
Bollinger bands could be seen as instruments of analysis but majorly technical analysis explained by a set of lines, showing movements of price that are plotted negatively and positively away from the SMA ie Simple moving average of an asset's price but can be shifted to the preference of the traders or asset users
How do they apply to Crypto Technical Analysis?
In several tools of technical analysis, Bollinger bands are surely one tool that can't be easily left out since their cogency is really much in the market analysis of an asset
Firstly we know that Bollinger bands explain how loud or silent a market is, that is they show how volatile a coin has been and when it had been over bought and over sold.
The following decisions as a trader is known as we can now know whether to buy or sell in such situations
With which other tool or indicator do you combine Bollinger Bands to analyze a Crypto? Justify your answer.
The bollinger bands consist of the upper band, the moving average which is the middle band and the lower bands. if the price moves above the moving average, it is an indication for a buy but if it move below the moving average it is an indication for a sell. And if the price touches the upper bands, there is a high possibility of a trend reversal which also indicates a sell but if the price touches the lower bands, there is a possibility of a trend reversal of a buy order.
.PNG)
how can it be used with the RSI indicator
.PNG)
if the Rsi is overbought and the price touches the upper bands of the Bollinger bands, that is an indication of a sell order
if the RSI is at oversold position and the price touches the lower bands of the Bollinger bands , that is an indicators for a buy order
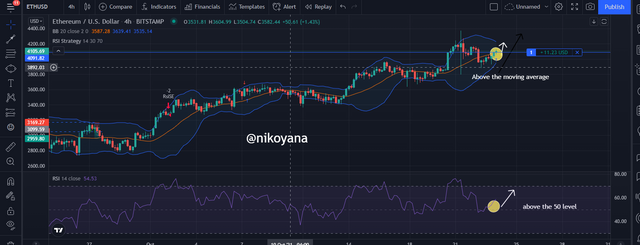
if the RSI,,is at 50 and above level while the price is also above the moving average, that is also an indication of a buy
if the Rsi is at 49 and below level moving downward while the price is below the moving average, and also moving downward, that is a clear confirmation of a sell order.
below are the screenshots of my justifications

CONCLUSION
The fundamental and technical analysis are bed rocks of the cryptocurrencies in which we cannot do without them if we really want to make a proper investment on any cryptocurrency. and a combination of the two will give you an edge in making any invesment needed
it is important to note that in the fundamental analysis as stated before we make use of financial metrics while in the technical analysis we make use of technical tools to determine the trend of the asset either in an upward direction or downward direction
I thank the professor @imagen for delivering this wonderful lecture, thank you all for reading through my post
images gotten from binance and tradingview
Gracias por participar en la Cuarta Temporada de la Steemit Crypto Academy.
Continua esforzandote, espero seguir corrigiendo tus asignaciones.