Head and Shoulders and Inverted Head and Shoulders Pattern- Steemit Crypto Academy- S5W2- Homework post for @utsavsaxena
A beautiful day to you all and a lovely welcome to the week 2 of this great academy and it was an excellently delivered lecture from the professor along side his new appointment which I also use this medium to say congratulations.
below is the mandatory questions and I have answered to the best of my understanding.


1. Explain Head and Shoulder and Inverse Head and Shoulders patterns in details with the help of real examples. What is the importance of volume in these patterns(Screenshot needed and try to explian in details)
HEAD AND SHOULDER PATTERN
The same way we look at a human physically and we see a head and the 2 shoulders, literally that is the simplest definition of the head and shoulder pattern. it is a structured pattern that predicts a bullish to bearish reversal on a chart over a specific period of time
It comprises of three major closes where the left and the right close are almost equal in height and the center is the highest close. it has been proven over years to be one the most reliable and efficient trend analytical indicators
COMPONENTS OF THE HEAD AND SHOULDER PATTERN
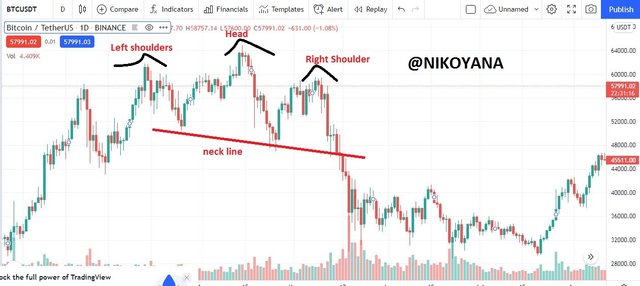
LEFT SHOULDER: The left shoulder is formed by the rise in the price of an asset followed by a corresponding retracement
HEAD after the left shoulder must have been formed, the price rises to a peak point higher than the left sholder.
RIGHT SHOULDERS The right shoulders are formed after the formation of the head which is the peak and the highest, there is usually a retracement and a rise in the price of an asset to equal the level of the left shoulder.
NECK LINE The neck line is the base line in which the start of the bullish trend began and the start of the bearish reversal.
Below is an example of the head and shoulder pattern
INVERSE HEAD AND SHOULDER PATTERN
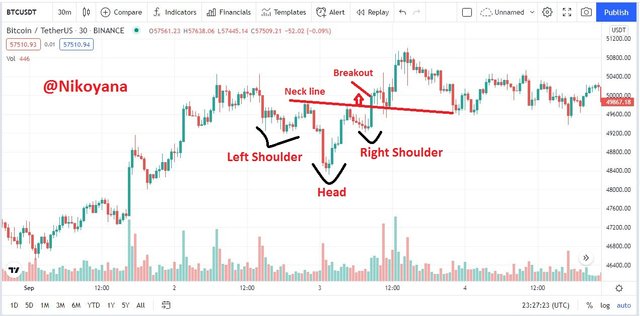
Just as I explained above using the example of a human physique, likewise imagine turning the human upside down with his head faced or touching the ground with his legs upwards. If you can imagine the picture of my explanation then you are right. literally that is the simplest definition of the inverse head and shoulder pattern. it is a structured pattern that predicts a bearish to bullish trend reversal on a chart over a specific period of time
It comprises of three major closes where the left and the right close are almost equal in height and the center is the lowest close. it has been proven over years to be one the most reliable and efficient trend analytical indicators for a bearish to bullish trend reversal showing that the buyers are taking over the market.
COMPONENTS OF THE INVERSE HEAD AND SHOULDER PATTERN
LEFT SHOULDER: The left shoulder is formed by the fall in the price of an asset followed by a corresponding retracement upwards
HEAD after the left shoulder must have been formed, the price falls to a peak point lower than the left shoulder level.
RIGHT SHOULDERS The right shoulders are formed after the formation of the head which is the peak lowest low, there is usually a retracement and a fall in the price of an asset to equal the level of the left shoulder.
NECK LINE The neck line is the base line in which the start of the bearish trend began and the start of the bullish reversal.
below is an example of the inverse head and shoulder pattern.
What is the importance of volume in these patterns
When we talk about volume on the head and shoulder it has a very great importance on the patterns
HEAD AND SHOULDER PATTERN
on the head and shoulder pattern, the volume is usually higher at the left shoulder following the price, but as the volume approaches the head it reduces indicating that the buyers aren't as strong as the left hand shoulder. when it gets to the right shoulder it decreases the more showing that the buyers are already losing interest in the market then we have the reversal.
INVERSE HEAD AND SHOULDER PATTERN
on the inverse head and shoulder pattern, the volume is usually higher at the left shoulder following the price, but as the volume approaches the head it reduces indicating that the sellers aren't as strong as the left hand shoulder. when it gets to the right shoulder it decreases the more showing that the sellers are already losing interest in the market then we have the reversal to the bullish trend.
2. What is the psychology of market in Head and Shoulder pattern and in Inverse Head and Shoulder pattern (Screenshot needed)
the psychology of the market talks about the behavioral pattern of the market during the formation of this patterns and I will be starting with the head and shoulder pattern followed by the inverse head and shoulder pattern so lets get to work
HEAD AND SHOULDER PATTERN
The head and shoulder formation pattern has different psychology on the market at different sections of the formations
THE LEFT SHOULDER
during the left shoulder pattern formation, there is usually an initial bullish trend on the market which usually indicates that the buyers are on the lead with a little retracement on the market.
just as we are familiar with our demand and supply story, we can ascertain that at this point, the demand of the asset is high and the supply of the asset is low. although not for so long as the sellers are not to be overlooked.
There is an upward movement in the price of the asset where the buyers are very active followed by a drag in sell of the asset causing a retracement of the asset.
THE HEAD
during the head pattern formation, there is usually a spring in the bullish trend higher than the left shoulder although not strong in volume like the left shoulder on the market from the retracement of the left shoulder which usually indicates that the buyers are back on the lead but not for long as the sellers are still not yet to be overlooked.
There is an upward movement in the price of the asset where the buyers are very active followed by a drag in sell of the asset causing another retracement of the asset.
THE RIGHT SHOULDER
during the right shoulder pattern formation, there is usually another bullish trend on the market which usually indicates that the buyers are back on the lead but not for long as the sellers take over the market turning the bullish trend to a bearing trend.
INVERSE HEAD AND SHOULDER PATTERN
The inverse head and shoulder formation pattern has different psychology on the market at different sections of the formations
THE INVERSE LEFT SHOULDER
during the inverse left shoulder pattern formation, there is usually an initial bearish trend on the market which usually indicates that the sellers are on the lead with a little retracement on the market.
just as I mentioned about our demand and supply story, we can ascertain that at this point, the demand of the asset is low and the supply of the asset is high causing a decrease in the price of the asset. although not for so long as the buyers are not to be overlooked.
There is a downward movement in the price of the asset where the sellers are very active followed by a drag in buy of the asset causing a retracement of the asset.
THE INVERSE HEAD
during the inverse head pattern formation, there is usually a spring in the bearish trend lower than the inverse left shoulder although not strong in volume like the inverse left shoulder on the market from the retracement of the inverse left shoulder which usually indicates that the sellers are back on the lead but not for long as the buyers are still not yet to be overlooked.
There is a downward movement in the price of the asset where the sellers are very active followed by a pull in the asset causing another retracement of the asset.
THE INVERSE RIGHT SHOULDER
during the inverse right shoulder pattern formation, there is usually another bearish trend on the market which usually indicates that the sellers are back on the lead but not for long as the buyers take over the market turning the bearish trend to a bullish trend.
3. Explain 1 demo trade for Head and Shoulder and 1 demo trade for Inverse Head and shoulder pattern. Explain proper trading strategy in both patterns seperately. Explain how you identified different levels in the trades in each pattern(Screenshot needed and you can use previous price charts in this question)
EXPLAINING DEMO TRADE FOR HEAD AND SHOULDER PATTERN
First of all in order for us to be able to trade, we need to identify the left shoulder, then also look for the head followed by the right shoulder as soon as we find the complete pattern, it is importand to draw a line which serves as a base called the neck line
The neck line is formed by drawing a line across the low of the left shoulder ad the ending low of the right shoulder.
after drawing the neckline, we watch the price break through the neck line and going below it in a bearish direction forming the bearish trend.
at this point, we are set for an entry
ENTRY WITH HEAD AND SHOULDER PATTERN
After the pattern is complete, we make an entry for a sell side trade. as soon as the price breaks the neck line we make the trade on the market order. it is also wise to wait for the price to retest the neck line if you are well experienced. there are other levels in which entries can be made.
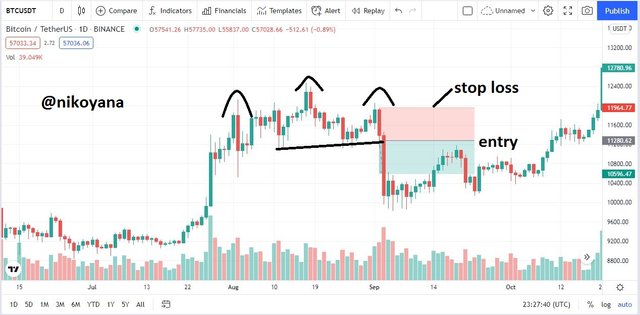
STOP lOSS LEVEL
The stop loss level is placed at the peak of the right shoulder to be on a safe risk- reward ratio.
TARGET LEVEL
In order to get the target level, there are a few steps to abide by.
The difference between the head peak and the low points of each shoulder should be taken
After getting the difference, we subtract it from the neck line inorder to get the target level to be taken.
Let's take an illustration below to help us understand better
let's assume the head peak is $50 and either of the low of the shoulder is at $40. so therefore, the difference is $10. from my explanation on the rules, this $10 will be subtracted from the neckline price (which is the low of either shoulder) which is $40. In order to get the target level, it will be ($40-$10) = $30
EXPLAINING DEMO TRADE FOR INVERSE HEAD AND SHOULDER PATTERN
This is just a direct opposite to the head and shoulder pattern and everything will be happening in the opposite direction just read closely.
First of all in order for us to be able to trade, we need to identify the left shoulder, then also look for the head followed by the right shoulder as soon as we find the complete pattern, it is important to draw a line which serves as a base called the neck line
The neck line is formed by drawing a line across the high of the left shoulder and the ending high of the right shoulder.
after drawing the neckline, we watch the price break through the neck line and going above it in a bullish direction forming the bullish trend.
at this point, we are set for an entry
ENTRY WITH INVERSE HEAD AND SHOULDER PATTERN
After the pattern is complete, we make an entry for a buy side trade. as soon as the price breaks the neck line we make the trade on the market order. it is also wise to wait for the price to retest the neck line if you are well experienced. there are other levels in which entries can be made.
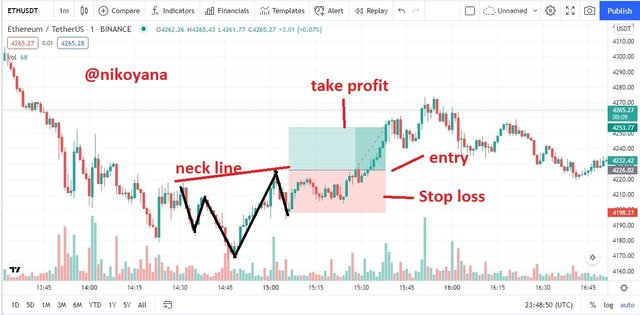
STOP LOSS LEVEL
The stop loss level is placed at the low of the right shoulder to be on a safe risk- reward ratio.
TARGET LEVEL
In order to get the target level, there are a few steps to abide by.
The difference between the head low and the high points of each shoulder should be taken
After getting the difference, we add it to the neck line in order to get the target level to be taken.
Let's take an illustration below to help us understand better
let's assume the head low is $50 and either of the high of the shoulder is at $80. so therefore, the difference is $30. from my explanation on the rules, this $30 will be added to the neckline price (which is the high of either shoulder) which is $80. In order to get the target level, it will be ($80+$30) = $110
4. Place 1 real trade for Head and Shoulder(atleast $10) OR 1 trade for Inverse Head and Shoulder pattern(atleast $10) in your verified exchange account. Explain proper trading strategy and provide screenshots of price chart at the entry and at the end of trade also provide screenshot of trade details.(Screenshot needed.)
In this question I will be using the chat of FTM/ETH at a 3mins time frame to be able to catch the minute time frame of the chart. I noticed a bullish trend that has formed the left shoulder perfectly with a little retracement in price of the asset and proceeded to forming the head at the peak had another retracement and started out the formation of the right shoulder at a height lower than the head and equal to the shoulder. forming a perfect head and shoulder pattern.
After noticing that the head and shoulder has formed perfectly well, I drew a neckline which joins the low of the left shoulder to the low of the right shoulder. I waited for the price to break the neck line and be converted into a bearish trend.
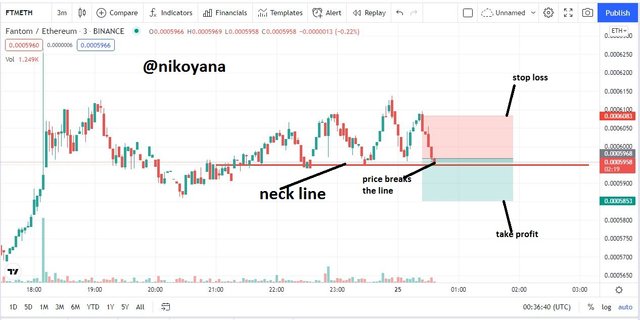
As soon as I saw this I executed an instant sell order at the market price and sold 12FTM as we can see in the screenshot below
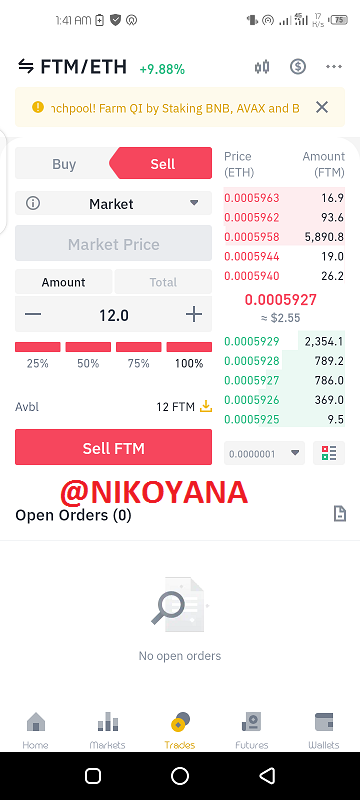
Below is the order details of the transaction showing the time and the amount filled.

After some minutes we can see the recent chart of the FTM/ETH showing and confirming the head and shoulder pattern for an effective sell
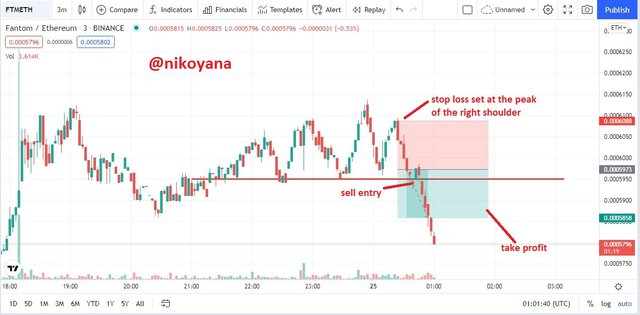
Although I made a loss in the trade but I was happy that I found a pair that had the head to shoulder pattern and took a life trade.
CONCLUSION
The head and shoulder pattern along side with the inverse head and shoulder pattern is a great reversal trend indicator and very effective at least I saw it first hand engaging in the practical aspect of this lecture despite a little loss but the knowledge was worth it.
In summary to the lecture the left shoulder is usually more with volumes than the right shoulder, the head is usually higher than the shoulders in the head and shoulder formation and much lower than the left and right shoulders in the inverse head and shoulder formation.
the success rate of the pattern is usually on a high base and I thank the professor for teaching us this great pattern. thank you all for reading and please comment if you can. stay safe.
Best regards
@utsavsaxena11