[ Crypto Trading with Moving Average ]-Steemit Crypto Academy | S6W2 | Homework Post for @shemul21
hello, welcome to the second week of the season 6 and I am glad to be here. today we will be talking about trading with moving average and I know you will be interested to learn.
It was a beautiful lecture delivered by the professor, I have read and understood the lecture and I will be answering the questions to the best of my understanding.

The most basic function of a moving average is to smoothen fluctuations. In the cryptocurrency market, they help predict where trends will head with the adjustments computed according to the time that has passed since the last one. This way, moving averages present another set of great tools you can use in making cryptocurrencies trading decisions.
In order to successfully trade crypto with a moving average, you need to know the concept of bullish and bearish stages. If prices are hovering below the MA, it is in a bearish stage. Conversely, if prices are shooting well above the MA, the market is in a bullish stage.
A moving average dictates the price trend. The most common strategy for timing entry and exit is to wait for the price of an asset to cross a commonly traded moving average from below or from above.
Crypto traders rely heavily on moving averages and other aspects of technical analysis when analyzing and trading cryptocurrencies. The moving average works well as a dynamic support or resistance in the market that is used in predicting an asset’s price direction, including its reactions to each new trading action.
Historically, different indicators have been used to identify trends with varying degrees of success. The fundamental function of each indicator is to calculate the trend of an asset, so traders can select the one that works best for their strategies. Commercial indicators are important, so they can have positive trades by trusting moving average indicators.
So there fore, the moving average is one of the most basic indicators used in trading, and it is referred to because of its simplicity in seeing trends. The timeframe or amount you use for measuring within this system also affects the results.
Below is an image of the moving average
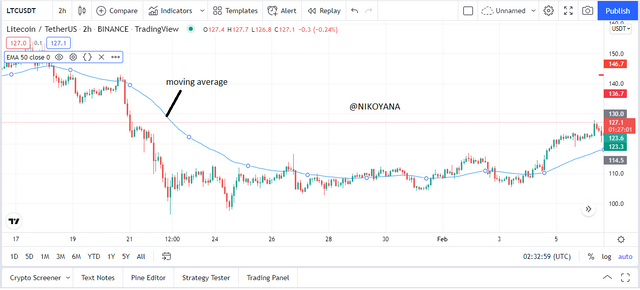
It is important to note that there are different kinds of moving average but in this homework post, I will be explaining the fundamental three(3)
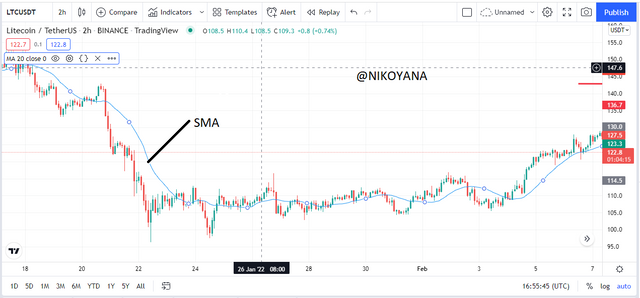
Identify the trend with the simplest indicator. If you are having trouble understanding trends when analyzing values, then you will find that simple moving average provides an excellent solution. The simplicity of the aggregation method in averages will somehow reduce the noise at time series in order to be able to discover the trend, in increasingly volatile markets.
We must understand that simple moving averages are weighted equally, meaning the weight of each period matters. An equal weight means that all data points have the same relevance and weight in the asset.
Calculation
SMA = [A1 + A2 +...+An] / n
A = average price data &
n= number of period
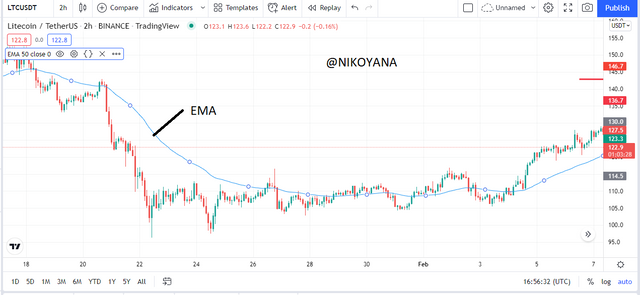
The Exponential Moving Average (EMA) is a powerful technical analysis technique and one found to be very useful for tracking trends, which isn't so different from the Simple Moving Average. aside a complex set of calculations
Exponential Moving Average is more effective in predicting future prices on cryptocurrency trading, while Simple Moving Average act as backup to Exponential Moving average. By combining the two averages, it is possible to get better results with your analysis.
Calculation
EMAc = (Cp × [s/1+n]) + EMAp × (1 - [s/1 + n])
EMAc = current EMA
Cp = current price
EMAp = EMA of previous day
S= smoothing factor
n = number of period
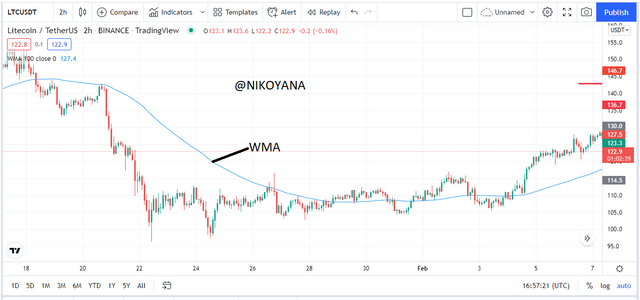
The weighted moving average assigns different weights to data points with different levels of importance. Safer trades are assigned higher weights and foolhardy investments are assigned lower ones to help you succeed in the stock market.
The Weighted Moving Average (WMA) assigns weights to the different data points with the most relevant data points considered to be more important than previous ones. The relevance or weights of the data point reduce with each previous period which makes it less relevant.
calculation
(P1 x n + P2 x [n - 1] + ... + Pn) ÷ (n x [n + 1]) / 2
| SMA | EMA | WMA |
|---|---|---|
| All data at a point are seen as relevant | considers recent data more relevant as determined by the set multiplier | Relevance reduces with every new period on the chart. |
| it lags behind price | very responsive to price change | responsive to price change but not as much as EMA but faster than SMA |
| More productive on a longer time frame | more productive on a shorter time frame | works with both short and moderately high frames |
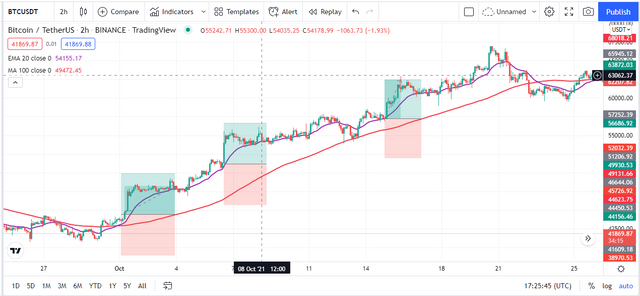
In this section, Just like I have already stated that the moving average is used to determine a buy and sell position. n this question I will be demonstrating that using the 20 EMA and 100SMA to determine a good buy and sell position.
BUY POSITION
For a buy position, the 20 EMA and the 100SMA must be below the price as we can see below showing that the buyers are in control of the market the 20 EMA acts as an entry signal when the price falls on the 20EMA and bounces upwards likewise the 100 SMA acts as a dynamic support. we place the stop loss above the 100 SMA and take profit at a 1:1 risk reward ratio or it can also be adjusted depending on the trader. let's look at the image below
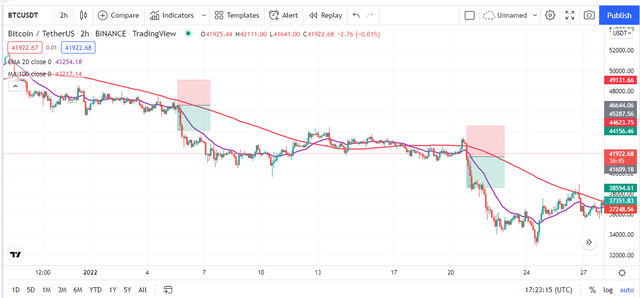
SELL POSITION
For a sell position, the 20 EMA and the 100SMA must be above the price as we can see below showing that the seller are in control of the market the 20 EMA acts as an entry signal for a sell when the price falls on the 20EMA and bounces downwards likewise the 100 SMA acts as a dynamic resistance. we place the stop loss above the 100 SMA and take profit at a 1:1 risk reward ratio or it can also be adjusted depending on the trader. let's look at the image below
To be successful in crypto trading, you need one of the best moving averages and a support that will stay stable. For a typical crossover, there is always a fast MA and a slower MA. The fast MA reacts to changes and crossovers with the slow MA for a bullish or bearish signal.
Using Moving Averages to detect trading signals is easier with a simple crossover, illustrated by two flat lines crossing each other. A crossover can also signify a momentum change, as the old MA will be replaced by the newer MA.
For a buy crossover, the 50 EMA which is the shorter EMA crosses over the 200EMA to indicate a buy signal and if we look at the chart below, we can see a bullish run for a long time. It is also known as the golden cross as it brings golden smiles to the heart of traders.
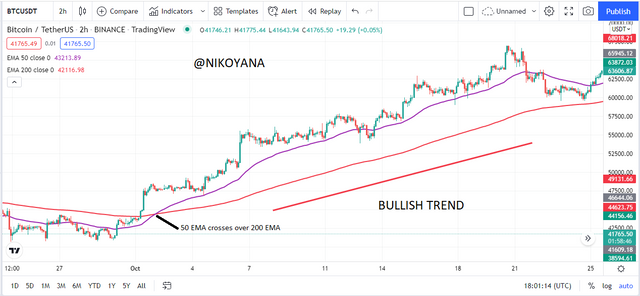
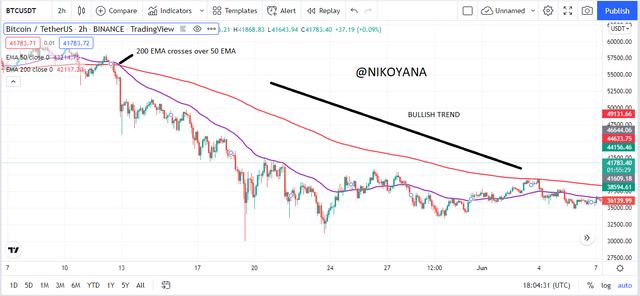
For a sell crossover, the 200 EMA which is the longer EMA crosses over the 50 EMA to indicate a sell signal and if we look at the chart below, we can see a bearish run for a long time. It is also known as the death cross as it brings about the fall of an asset or security.
Moving averages are generally lagging indicators and so do not provide the best entry point, resulting in less profit yielded than when using less or no lagging indicators.
It's difficult to know the period of a moving average. With small periods, it generates many signals which may be false. With larger periods, for short-term profit, the signals would be rare.
When the market is very volatile, the moving average tends to create noise in the process of generating many signals
The moving average is seen as an old fashioned indicator by traders and usually used with other indicators for an excellent result.
CONCLUSION
Having come to the end of this homework post it is important to keep in our minds that over the years, the moving average has always been representing and being useful in the crpto market. With so many other indicators developed since its invention, it is important to remember that no single indicator can be used in a vacuum.
In this homework post, we have been able to discuss the different types of moving average, how to initiate a sell order and a buy order using the moving average, we also defined and explained a golden cross and a death cross as regards the crypto market.
Thanks for going through my homework post see you next week
best regards
@shemul21
