[Crypto Trading Using Zig Zag Indicator]- Crypto Academy /S6W1-Homework Post for professor @kouba01
Welcome to the season 6 of this great academy, It's a beautiful day and I am glad to be writing this homework post on the greatly delivered lecture delivered by @kouba01. without wasting much time, let's dive into the questions for the week.


You can use a zig-zag indicator to identify price movement trends on the Zig Zag graph. The diagonal lines represent peaks from which you can determine trends.

The Zig-zag indicator is used in joining different price points of an asset on a chart to spot the highest and lowest prices. It is also described as connecting highs and lows for an effective prediction. This increases the accuracy of trading, capitalization, and making good in investing in cryptocurrency.
The Zig-Zag indicator is used as one way to gather information when about to invest in trade. Unlike other trend-based indicators who help predict unexpected market fluctuations, the Zig-Zag simply provides traders with the ability spot trending prices and look for shifts in trends.
Traders use the zig-zag indicator to find potential levels of support and resistance, both of which can be helpful when trading. This is particularly true in stronger trending markets such as the cryptocurrency world. Understanding how the indicator is drawn will provide traders with a useful take on prices. Whenever prices are reversed by more than a pre-selected percentage, lines are drawn at set distances to follow these price changes, forming the indicator.
Here is how the zig-zag indicator is calculated
Zig-Zag (HL, %change = X, retrace = FALSE, LastExtreme)
If % Change >= X, plot Zig-Zag
where;
HL = the High-Low price series or closing price series
%change = the Minimum price movement in percentage
Retrace = Is the change of a retracement of the previous move or an absolute change from peak
Last Extreme = when the extreme price is the exact over multiple periods
Amongst the many factors to consider trading with Zig Zag, we will highlight some key steps.
- pick or choose a starting point
- find the percentage (%) price movement
- with the zigzag indicator identify the next swing high
- fix a trend line connecting the points
- repeat the process until the highest swing high
The zig-zag indicator has two main parameters, with each parameter relating to different functions of the indicator. The deviation will help calculate the depth, but the depth must also work together effectively to accurately assess the depth with clearer distinctions.
Deviation Parameter refers to the minimum percentage of price movement in the stock’s value that must happen before it is considered a valid zig-zag swing point. The standard deviation is set by default at 5; if the price moves by 5% or more, it is accepted as a valid zig-zag movement - let's look at the general parameters.
Depth Parameter refers to the determined minimum number of periods that a new high or swing low would not be plotted from the previous swing point by the indicator. This parameter can also have a default setting of 10 periods.
How to fix up the zig zag indicator
- log in to tradingview and open up charts

- click on the indicator icon at the top of the screen and the screen will display as we can see below

- search for the zig zag indicator on the search button and it will be brought up, click on it

- the zig zag indicator as we can see has been added below

- every trader can also play around with the style and settings of the zig zag indicator to suit his taste and this can be done by clicking on the setting button of the zig zag indicator.

- The Zig Zag indicator is useful for calculating the typical gesture of the asset. The sensitivity parameter should be altered based on the timeframe, trading system, and type of assets. below is the image of a successfully added zig zag indicator

The Zig Zag indicator draws a diagonal line between the successive highs and lows on the charts to identify trends. It accurately identifies trends based on more data points than the three preceding them things it has determined as previously mentioned.
First, the zig zag indicator moves up with the increasing price of the asset. The bar's high is higher than its previous high and the low is also higher than the prior low. When it sees this trend, it confirms an uptrend structure in the market of the asset Its Price
below is an example

To identify a downtrend, compare the zig-zag indicator to the price of the asset. When you see that new low is lower than previous low and that the high has also fallen beneath the latest low then you will know that it is confirming a downside trend.

How to determine a buy or sell order
The immeasurable volatility of modern-day cryptocurrency trading leaves many traders searching for the next best thing to avoid the dreaded feeling of missing out (MOFO). The zig-zag indicator is a pattern that can be used to determine whether you should buy or sell an asset. When the zig-zag goes up, we execute a buy order; when it falls, we execute a sell order.
For a Buy Order
Using a zig-zag indicator for trading is a great way to enter a trade. To execute a buy order, you should place the trade immediately after the formation of the next low higher than the previous low, found in an uptrend market. For example, you're watching Bitcoin and noticing that it has just peaked at $3000, then dipped to $2900, then $2850 before experiencing one last spike all the way up to $3000 again. You place your buy order right when

From the above chart, you can see that the buy order was placed just after the formation of the low higher than the previous low and stop-loss placed just below the newly higher low formed. This strategy is one of many that traders use with indicators to help them find opportunities in crypto trading.
For a Sell Order
A sell order can be executed with the zig-zag indicator. Set the stop-loss above the resistance, just under the new high that was formed, or to ever put it before or after where it meets resistance.

Here's an overview on how the Zig-Zag indicator is used in determining a sell order
From the chart above we can see that the sell order was placed as soon as the new high was formed lower than the previous high.
In this section, we would look at how to use the zig-zag indicator for crypto trade. The support and resistance levels are very important points or swing points in the price of an asset that depicts buyers & sellers reactions to the price of an asset in the crypto market. A strong support and resistance level is indicated by the number of times the price of an asset previously reacted around those points.
The zig-zag indicator is highly recommended for crypto traders. The basis of the indicator help determine retests taken validation levels of support and resistance.
Support Level
n the process of identifying a support level using a zig-zag indicator, traders will plot a series of low levels. A bounce from that level will indicate that the asset price at that support level is stronger than an instantaneous dive. The illustration below (chart) displays such an event and its effects.

Using a zig-zag indicator for crypto trading allows practitioners to let the charts do the work. The zig-zag indicator has identified likely support levels and how they can be exploited during a trend by traders from the above chart.
Resistance Level
In Identifying the Resistance level using Zig Zag indicator, a multiple or series of a horizontal high level is plotted with a re-bounce from that level. A clear illustration can been seen from the chart below of how this occur

A zigzag indicator is a price oscillator pattern that marks resistance levels through a multiple of retests before a rejection of the asset at that level. The chart from the example shows us that the resistance levels have been identified by the zigzag indicator, and then a rejection of the price at that level.
One indicator that may produce good signals for combining with the ZigZag indicator, is the Commodity Channel Index (CCI). There is a CCI for crypto charts that may generate stronger signals. For the purpose of this lesson though, we'll use the CCI with ZigZag indicator.
This Trading System uses the Commodity channel index(CCI) Indicator combined with the Zig Zag indicator. The Commodity channel (CCI) is an oscillation-based indicator that reflects the condition of the market as to being overbought or oversold. It has a bound range which helps determine whether the CCI reading is over 100 and if so, this would indicate being Overall Bias as being Overbought. likewise when the CCI reading is below 100 it indicates as being oversold.
This article explains how to use the zig-zag indicator together with the CCI indicator to take advantage of trend changes. The CCI is used to give us information about current price fluctuations. When it gets into the appropriate zone, the zig-zag tells us that there's a trend break indicating potential for buy or sell opportunities.
BUY ORDER WITH ZIG ZAG AND CCI
With a simple Zig Zag Indicator, buy entry trades can be filtered through two features. The first is a CCI that is at least at a 100 value and a higher high of a candle. A clear illustration can seen in the chart below.

Chart signals play an important role for trading. It helps to get an insight about the future direction before you take a decision. For instance, moving the price of the asset will be picking up momentum and CCI indicator is peaks above 100 mark which caused a buy signal.
SELL ORDER WITH ZIG ZAG AND CCI
With a simple Zig Zag Indicator, buy entry trades can be filtered through two features. The first is a CCI that is at least below 100 value and a lower low of a candle. A clear illustration can seen in the chart below.

This chart above shows an example of a cryptocurrency trade. When the indicator crosses below -100, it indicates that the current low is below the previous low, and CCI indicator is also seen to be below -100. A sell signal will be executed when this occurs and take-profit will usually coincide with the nearest swing point, whilst stop-loss can either be placed above the previous low.
In this section, I would be using zig zag indicator with other indicators to avoid false signals. Generally, there is no technical indicator that can function 100% effectively without the help of other indicators as such this one isn't left out. I am going to develop more on three specific indicators including Fibonacci indicator, Moving Average Cross, and the Relative Strength Index.
ZIG ZAG WITH MOVING AVERAGE
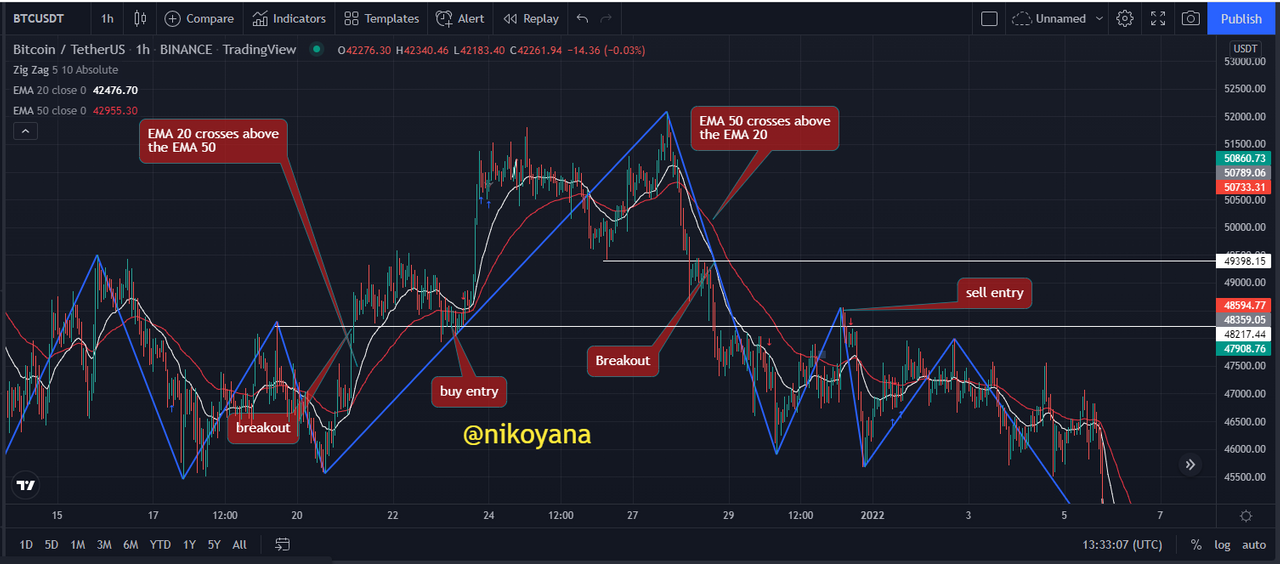
The Zig-Zag indicator is a strategy for trading based on the crossing of successive exponential moving averages with one coefficient. First, it catches all patterns, and then one trade signal always comes from the pattern when the EMA 20 crosses below the EMA 50 and second one when EMA 50 crosses below the 20 and so on.
When trading with the zig-zag indicator and moving average, we wait for a candle to close above the previous high or low after which we then cross-check to see if the two EMAs cross each other. An illustration is shown below in the chart.
There are many indicators that can be used for crypto trading, but the most popular by far is the Zig Zag Indicator with the moving average crossing indicator. This indicators helps you identify trends and spot false signals using TradingView.
ZIG ZAG WITH FIBONACCI
The Zig Zag Indicator is used to identify the possible end of a pullback and continuation of a macro trend. The Fibonacci retracement tool helps by using the Fibonacci number sequence golden ratio.
Traders can use the Zig Zag indicator with Fibonacci retracement levels to precisely open trades. The trader waits for highs or highs of the zig zag before buying predefined short term intervals, and also sells predefined long intervals on low points of the zig zag.
The Zig-Zag indicator can be combined with a Fibonacci indicator to identify trends and spot false signals. It is possible to read the relationship between these two indicators to understand when a trend will end or false signal has shown up.
This paragraph details how to use an indicator in order to make optimum decisions in crypto trading. From this listing, we can see that the current trend of the price in the asset is bullish based on an indication of a zig-zag indicator. We see that in past swings, there has always been good correlation with the 50% Fibonacci retracement level. Furthermore, our stop-loss will be placed below the previous higher low point and our take-profit will be set at the nearest.

ADVANTAGES
The zig-zag indicator helps to ignore the fluctuations in the market due to the price fluctuation of an asset.
The zig zag indicator can fit into all time frames
the zig-zag indicator on crypto charts reveals macro trends
The zig-zag indicator provides broad and highs and lows. The highs and lows in this indicator is a popular method traders use to predict future stock price movement.
To a great extent, the zig zag indicator gives an accurate result
DISADVANTAGES
The cryptocurrency trading industry is dominated by the use of the zig-zag indicator. While this tool has many benefits, it also has limitations. These include:
It does not provide additional information, but helps traders only find the current trend.
The Zig-Zag indicator tracks the price of an asset in relation with the current market, but does not predict its next movement without support
This article provides an introduction to the concept of the zig-zag indicator and how it is calculated. We will go on to look at how these fundamental parameters can be configured and consider what we have learnt.
We discussed how the zig-zag indicator is able to predict market movements, identify support and resistance levels, and more specifically on cryptocurrency charts. We also looked at how to use the zig-zag indicator to generate profits by using crypto charts as examples.
Thank you professor @kouba01 for this great insight.
ALL UNSOURCED IMAGE REFERENCES : TRADINGVIEW
