Crypto Trading Using Trix Indicator - Crypto Academy /S6W3-Homework Post for kouba01
It is amazing to be on the week 3 of this academy, as we are dealing with the trix indicator and we will be discussing about every section of this indicator along side with its pros and cons. Let's get to work below
.jpg)

Trix is an indicator commonly used to determine the price trend. It does this by considering three exponential moving averages.
A trix indicator is reacting to price fluctuations quickly, so you don't need to panic when your prediction goes against you. And this indicator solves the problem of false signals by including three different averages in its formula.
Although Trix solves the problem of false signals, it doesn't give an entry signal in the market. However, it's a good indicator that can be used to identify trend changes. It works well when combined with other technical tools or indicators that provide entry into a market.
Working Principle of TRIX
Triple Exponential Average (Trix) is based on three exponential moving averages and can be plotted in its own indicator window.
With the simple moving average, the recent values are given more weight and this is unlike correlated exponential moving averages. The Simple Moving Average reacts slower than the Exponential Moving Average, but it's less responsive to price changes.
Exponential moving averages can be too reactive to the market and at times, may give out false signals. Huston devised a method, Trix, that improves upon exponential moving averages.
Trix was developed to provide a solution to the problem associated with simple and exponential moving averages. Trix uses three exponentially weighted moving averages to more accurately signify if prices are rising or falling.
The Trix indicator can be used to identify bullish and bearish conditions and it can also be used to identify trend reversals.
Like I said earlier, the formula for Trix is based on three moving averages. The Trix indicator works by using exponential moving averages, so to better understand how it calculates these values, we should first see how they work.
Calculating the moving average is a simple process. It uses the last prices and calculates them to get the average of their value and then calculates based on what period was chosen. Traders can choose any value they want, I will use 14 here as an example.
the original EMA formular is = EMA = [CP × W ] + [p EMA] × [1- W]
CP = Closing Price
W = weight
pEMA = Previous day EMA
so therefore for a double EMA = EMA [1st EMA]
to that same effect Triple EMA = EMA [2nd EMA]
The Trix indicator formular = (3EMA [CP) - 3EMA(CP - 1)] / 3EMA(CP- 1)
let's look at the image of the trix indicator below

After adding the indicator, you can configure the trix indicator adjusting the periods and style as well as the visibility. of the indicator by just clicking on the setting icon on the trix indicator and the next window will appear.

The Trix indicator, which can be used to help with trading decisions, needs a specific time period. With shorter periods, it is more effective for intra-day and day-trade strategies. For swing traders, who trade in the short-term but over long periods of time, or position traders who trade in the long term over a long period of time it can provide inaccurate signals.

All details can be adjusted based on the trading style of the trader and in the image below we can see that the period has been changed to a period of 14

Trix indicators use EMA to show whether the trend will be bullish or bearish in the short term. If the latest price of an asset is above its long-term moving average, then the trend at this point will be bullish; if it's below, then it will be bearish.
The Line of the Indicator is located below and above the Zero Point. When the price or trend goes up, the line will cross above it. When the price or trend goes down, the line will cross below it.
The cross of the Trix line above 0 signifies a trend to be trending upward lets look at the buy signal below.

When a trader sees that the Trix indicator has crossed below the zero line, a change from a bullish trend to a bearish trend has occurred. An example of when this may happen can be seen on the chart below.

Trix indicator is often helpful in filtering the signals. It's very effective in the long-term, but it can't be used as effectively in other time frames. I will give an example of Trix's limitation in a short term timeframe with a graph

From the chart above, we can see the section 1 has indicated that the price action was in a bullish movement and we can also see that the trix indicator crossed the zero mark early enough, indicating a buy signal on time.
in 2 we can see that there a sell signal but it was lagged behind the price and didn't indicate for an early sell signal in correspondent to the price action.
In 3 there are actually three signals but I highlighted 2 which is the sell and the buy signal respectively, in the sell signal we can see there was a delay in the entry of the trix and the bearish trend started before the signal. likewise in the buy section, the entry was made on time and the trix indicator showed a buy signal early enough for buyers to take advantage off.
In section 4 we can clearly see a divergence showing that the trix could also give rise to a dvergence to help filter the signal. I will be talking more about that in the following questions
We have spent some time discussing the Trix indicator. You can also trade using a 9 period MA of the Trix indicator. The signals will be similar to that of the MACD.
Emulating the same approach of the MACD crossing signal on Trix, we'll go long when this crosses above the moving average and short when it crosses below.
Let’s compare the MACD to a 9 period moving average to see the difference in both indicators. The MACD oscillates above and below a zero line, but the method with 9 periods will have a more elevated histogram.

From the chart, we can see that there is a clean and smooth Trix indicator signal line which is less susceptible to noise and price fluctuations. The signals of the MACD are rendered almost useless due to unneeded noise.
The Trix adds an indicator that alerts the user when a trend is occurring. When the line of the Trix goes above 0, this is a signal that a bullish trend will likely occur. Similarly, if the line of the Trix goes below 0, this signals a bearish trend.
Divergence forms when the market is too oversold or overbought, and traders should expect a reversal of the trend or a trend continuation in a long run but most times a reversal once it occurs.
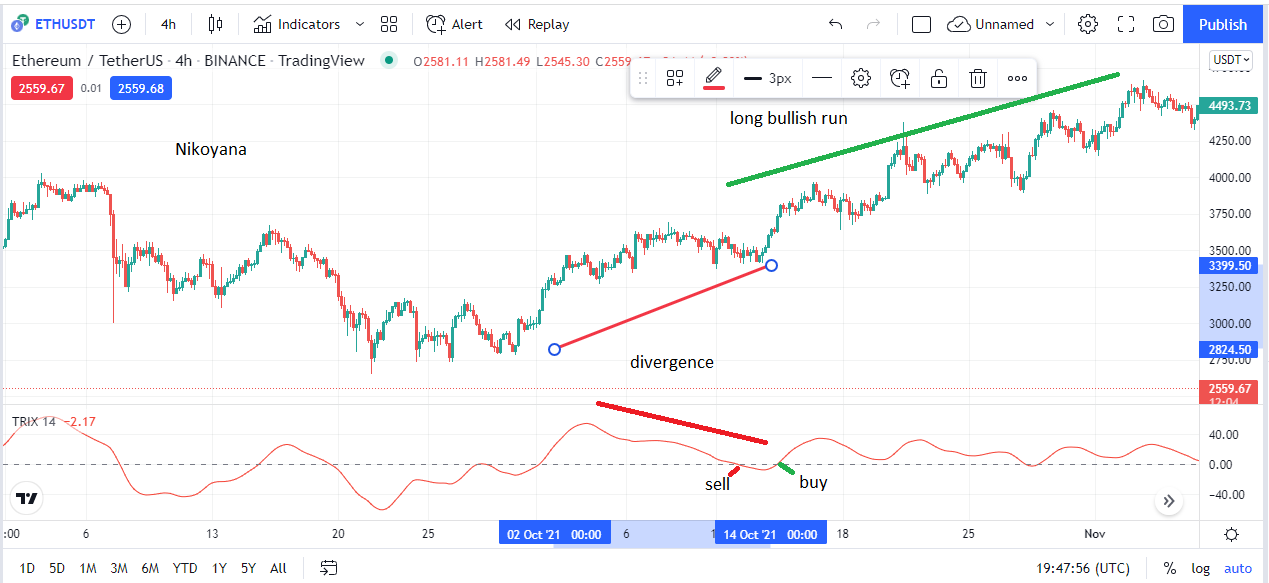
From the chart of the ETH/USDT above we can see a clear divergence in which the price action was ascending and we can clearly see the the trix going for a sell signal. like I explained earlier, that a divergence doesn't always mean a reversal but could also mean a long trend continuation run. which is what we can see above.
if we observed clearly, we can see the trix gave a quick sell and buy positions making it a great entry position for the bullish long run created by the divergence.
By combining Trix with other technical indicators, it becomes possible to understand the price trend more clearly. In my explanation for the importance of zero crossing, I explained why combining these two indicators can be a good solution to this problem.
Technical indicators often give false signals and it's best not to use an indicator to predict or take trading decisions. Trader are advised to combine at least two indicators together before they take a position into the market.

From the ETH/USDT chart, we can see that 2 EMAs were added to the chart to help get an accurate entry decision. in determining an entry for a sell or buy position, when the long ema crosses over the short ema, it is a clear indication for a sell. likewise, when the short ema crosses above the long ema, it is a clear indication for a buy.
I used the 20ema and the 50 ema to determine the entries. we can clearly see that the EMAs gave an early entry when compared to the trix indicator in which someone who made an entry with the ema must have made enough profit before the one using the trix
It is great to combine the indicators and the emas is one good pair that I could advise to be used with the trix.
ADVANTAGES
The trix indicator, is actually a very good way to identify when the trend is bullish or bearish.
With a Trix indicator, you can filter out unnecessary fluctuations in the price of stocks to avoid false signals in the market.
The trix divergence strategy can be used to determine reversals in markets alongside trend continuations as we saw an example above.
The indicator can be more efficient than other technical analysis tools. With this, there is the increase of signal that comes from the indicator.
DISADVANTAGES
The disadvantages of the indicator Trix is that it lags behind price. This can be attributed to the price data points included in its calculation, which may trick traders into opening positions after the price has already moved and is about to reverse.
It is not advisable to use it alone
Technical indicators are useful to determine the market direction and identify trends. Trix (Triple Exponential Average) is a popular technical indicator that consists of only one line, which oscillates up and down in its indicator window. The cross above zero scale is an identification for bullish trend, while the cross below the zero scale is an identification for bearish trend. Divergence can also be used to identify reversal in the market.
The Trix indicator is very similar to MACD, but Trix does not account for noises in the market.
Although Trix indicator can identify trends and filter out false signals, it is important to note its limitations. Combining it with other technical trading indicators is an effective way to filter out noise.
Best Regards
@kouba01
IMAGE REFERENCES: tradingview
