Crypto Trading Strategy with Triangular Moving Average (TRIMA) - Crypto Academy |S6W4| - Homework Post for Professor @fredquantum
Welcome to week 4 of the academy, this assignment was the most hectic of them all but I managed to pull through. In this study we will be looking at the TRIMA indicator and all about it functions. stay tuned
.jpg)

Moving averages are used to identify the direction prices will move in the future. They do this by using the average closing prices of an asset over a period of time. Simple moving averages lagging effect can give traders inaccurate information and could lead to the wrong decision in trading.
The TRIMA indicator was developed as an advanced Simple Moving Average, but it adds weight and filtering to eliminate noise. It's a doubled smoothed SMMA, so traders can be confident in their trading signals.
The market for cryptocurrencies is highly volatile and prices fluctuate unpredictably. TRIMA indicator is the best way to filter out the misleading information and get an accurate signal about the market.
It's quite easy to set up the trima indicator,
First of all we will navigate to www.tradingview.com and open a chart page
then click on the indicator button as seen below
.PNG)
- Search for the trima indicator and click on the highlighted indicator as seen below
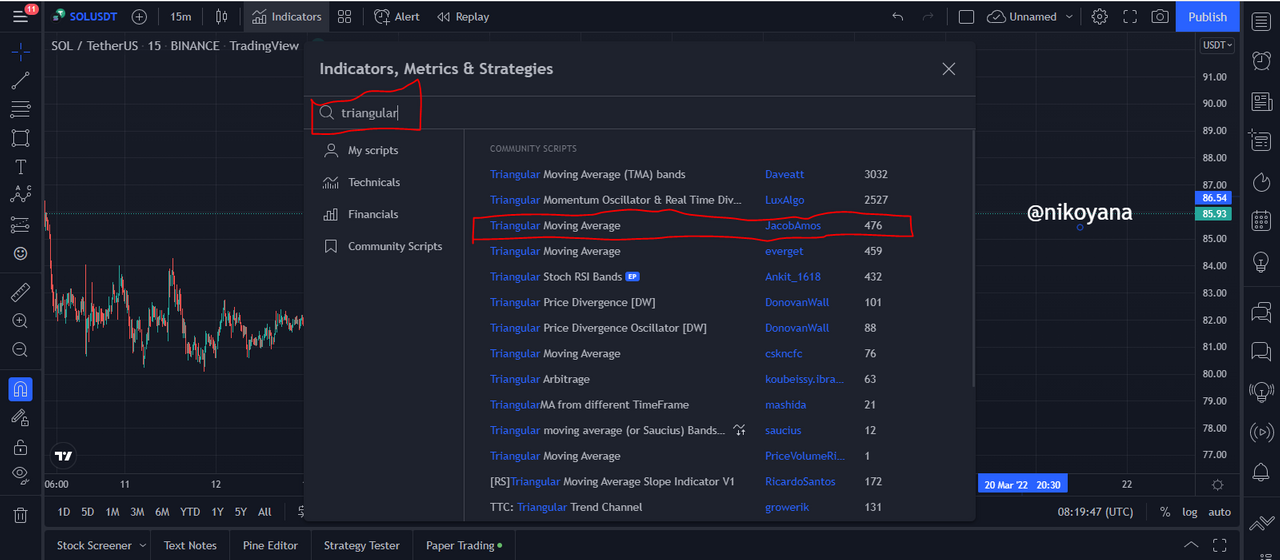
- hover around the added indicator to see the setting button and click on the button to adjust the input, style and visibility.

HOW TO CALCULATE TRIMA
the TRIMA is made up of SMAs so to that effect let's get the formula for the SMA
SMA = {P1 + P2 + P3 + P4 +...Pn}/ n
Where P = price of asset or security
P1 - P4 = Price of asset or security at 4 different periods.
n = total number of Ps
Pn = last price of asset or security.
therefore a TRIMA = {SMA1 + SMA2 + SMA3...+SMAn}/n
It is important to identify trends in the market before making a trading decision. The TRIMA indicator is a trend-following indicator that can indicate the direction of price accurately - this depends on the periods used. A trader must pick the period that matches their trading style. If you're scalping, use shorter periods to get more recent price information. If you are swing trading, choose a higher period to eliminate noise from intraday fluctuations.
IDENTIFYING AN UPTREND
When someone is trading in an uptrend, their trading session will become more and more profitable as time goes on. They will be making higher and higher lows on the chart. This uptrend can be confirmed by looking at the TRIM indicator, which is a technical oscillator that predicts whether or not this trend will end soon, and you can see that it is staying above the SOL/USDT chart.

As we see in the chart, price has been breaking above the TRIMA indicators, signaling that an uptrend is happening. A break below the TRIMA indicator is seen as a trend reversal signal.
IDENTIFYING A DOWNTREND
During times of identifying a downtrend, prices are seen falling at lower highs and lower lows. This can be seen on the TRIMA as the price is trending below the indicator. An example of this can be seen on the SOL/USD chart below.

The TRIMA indicator can serve as a dynamic resistance to price when the market is in a downtrend. To help determine if the TRIMA signal is valid, it should be confirmed by other signals such as RSI.
Traders can make strategic trades with support zones which has increased buying and selling interest. Dynamic trading zones are plotted automatically as the market changes its conditions, as opposed to having to manually draw horizontal lines on the chart.
Support and resistance can be dynamic or static. Dynamic support and resistance relies on indicators, such as moving average, Bollinger Bands, Heikin Ashi, TEMA to see if the asset is stable or unsteady.
TRIMA’s indicator also shows good dynamic support performance. As the price of a stock goes up, it hits the TRIMA indicator but only for a short period before reversing. This dynamic reinforcement can be used as an entry point for entering into a buy trade. For example, the following is an example of a buy opportunity using TRIMA’s line.

This chart above shows how the TRIMA indicator serves as a boost to price during an uptrend, and how rejection creates a reversal in the downward trend for a buy position.
A dynamic resistance is a retrace that follows the TRIMA indicator. This type of resistance typically occurs at the top of a downtrend. At first, it forms a tight range, but then after that, the price reverses direction and goes back down.

On the chart above, we can see that when the price retraces and touches the TRIMA at a line of resistance, it is possible to execute a sell trade after a reversal.
TRIMA IN A CONSOLIDATING MARKET
In a consolidating market, or range-bound market, prices bounce around support and resistance levels with low volatility in the underlying assets. The TRIMA indicator is seen during these markets because of the equilibrium in supply and demand.

In this chart, we can see the the TRIMA indicator behaving in a different way at various points. When price was consolidating, the line moved inside of it. An important point is that when the TRIMA line either went above or below price, this signaled a big change.
The TRIMA indicator is created to filter out noise and price fluctuations in the market. This enables a trader to enter the market at a lower price. Strengths of the indicator are that it is double smoothed, and consequently lags behind price.
To account for the lag in TRIMA indicator, we will combine two TRIMA on the chart. One with a fast period and the other with a slow period. This will create a "combo indicator" that can filter out noise in the market while reacting to recent price movement. The crossover between these two TRIMA serves as buy and sell signals in the market.
On the chart, I have added a 9-period TRIMA as the shorter period and also the 25 period as the longer period TRIMA. These two periods are suitable for my scalp trading style because I get price signals by using the 1-hour timeframe.
FOR BUY
for a buy trade to be is seen, the short-term TRIMA crosses above the long-term TRIMA, this is seen as a bullish trend reversal signal.

From the chart that we can see above, we can notice that the shorter period crosses over the longer period, indicating a buy opportunity which is seen as a perfect entry.
FOR SELL
The short TRIMA cross below long-term TRIMA acts as a trend reversal signal from bullish to bearish, allowing for a sell trade opportunity with proper trade management.
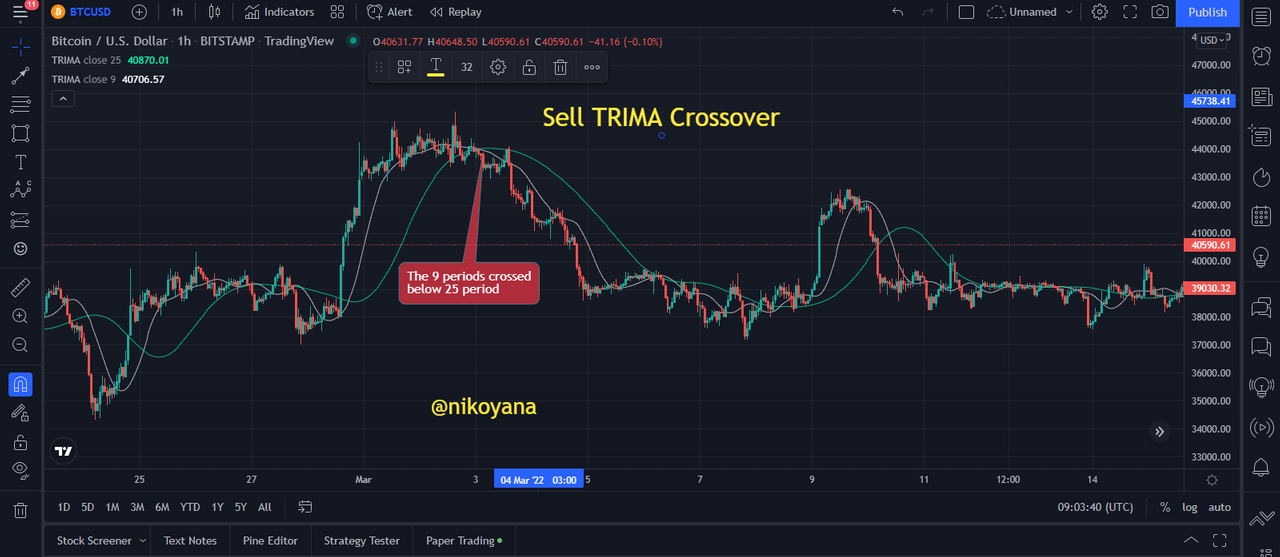
From the chart that we can see above, we can notice that the shorter period crosses below the longer period, indicating a sell opportunity which is seen as a perfect sell entry.
FOR CONSOLIDATING
When the market is in a consolidating stage, there is no point in opening up an active position as the price can go up or down. If a crossover is noticed, it's best to wait before making an entry into the market. This can be seen in the example below.

From the chart above, we can see that the price is neither above the crossovers or below and does not indicate an active opening for an entry.
Here I will be entering the criteria for both bullish and bearish reversal
CRITERIA FOR BULLISH REVERSAL
Add two indicators to the chart. A fast period and a slow period. Also, if you add the RSI indicator to the chart, it will be easier to see the peaks and valleys of the stock market.
The RSI should go below 30 if the market is going down, or go to the oversold region
Wait for short TRIMA to cross above long TRIMA and then execute a buy trade after at least two candlesticks form.
The stoploss and take profit placement should be strategic. A good ratio to use for risk-reward is 1:1 and the stoploss will be below the dynamic support point.

CRITERIA FOR BEARISH REVERSAL
Add two indicators to the chart. A fast period and a slow period. Also, if you add the RSI indicator to the chart, it will be easier to see the peaks and valleys of the stock market.
The RSI should go above 70 if the market is going up, or go to the overbought region
Wait for short TRIMA to cross below the long TRIMA and then execute a sell trade after at least two candlesticks form.
The stoploss and take profit placement should be strategic. A good ratio to use for risk-reward is 1:1 and the stoploss will be below the dynamic support point.

MACD + TRIMA
The MACD is a momentum-based indicator which can be used to determine price direction. The MACD is made up of two EMAs: a daily fast period EMA and a slow period EMA. A crossover of the fast period EMA above and below the slow period MA provides trend reversal signals. I will use the crossover on the MACD to confirm trends on the TRIMA indicator.
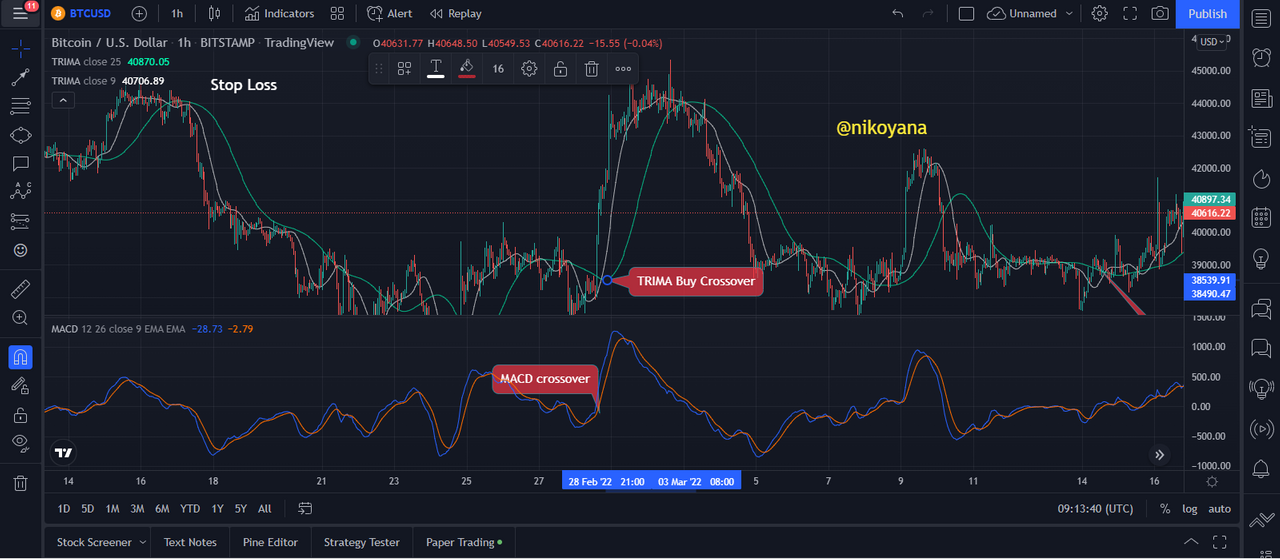
from the image The crossover of the slow and fast period MACD over the EMA signals a bullish trend reversal. This is seen in the TRIMA afterward with a crossover of the slow and fast period TRIMA.

For a bearish reversal, we can see a crossover of the slow period EMA below the fast period EMA which is a bearish reversal signal. For example, we can see a positive cross over (update) of the slow period TRIMA below the fast period TRIMA which signals a bearish reversal.
PLACING A DEMO TRADE

Looking at the RUNE/USDT chart above, we can see the RSI in an overbought position and we indeed expect a reversal on the chart from a bullish to a bearish, Likewise we can also see that the TRIMA is indicating a sell position as the short TRIMA crosses below the long TRIMA. immediately I placed my stop loss and take profit on a 1:1 RRR and execute the trade.

Above is the details of the executed trade for a sell position.
REAL TRADE

Looking at the LUNA/USDT chart above, we can see the RSI in an oversold position and we indeed expect a reversal on the chart from a bearish to a bullish trend, Likewise we can also see that the TRIMA is indicating a buy position as the short TRIMA crosses above the long TRIMA. immediately I placed my stop loss and take profit on a 1:1 RRR and execute the buy trade on my binance.
below is the image of my verified binance
.jpeg)
here is the image of my trade of LUNA/USDT
.jpeg)
PROS
TRIMA indicator helps to smooth out the noise in this market
It is difficult to identify when a fakeout in the market will take place, but the TRIMA indicator provides a clean and accurate signal that can help traders identify the fakes.
When looking at a chart, it is easy to tell when the trend is going up or down.
Trading signals are more accurate with the use of two TRIMAs. These indicators can also help determine market trends.
CONS
The TRIMA indicator is lagging behind the price, so this will trick a trader into opening a position when the price has already moved.
It is not wise to use the TRIMA indicator alone. better when combined with other indicators.
The TRIMA indicator is a trend-based indicator with an added advantage over the SMA. The indicator is double smoothed, which smooths and removes any noise in the market. TRIMA also serves as both dynamic support and resistance to price. The indicator is undoubtedly a wonderful way to learn valuable price information.
You can combine the TRIMA indicator with other trading tools, like the RSI, as a confirmation tool.
AMAZING REGARDS
@fredquantum
IMAGE REFERENCE: TRADINGVIEW