Crypto Trading by Identifying Support and Resistance - Steemit Crypto Academy |s6w3| - Homework Post for Professor @shemul21
Hello guys, welcome to the week 3 of the crypto academy learning where we would be explaining all that concerns the support and resistance of an asset along side with the pros and cons of the support and resistance. Let's read and learn.
.jpg)

Support and resistance play a major role in technical analysis, which is why any trader should learn how to identify these points. These points can often be the deciding factor in whether an asset will continue to rise or fall.
Areas of support and resistance are areas of the chart where price has difficulty of going lower or higher, and bounces back from the area. These are defined with area's where price slows down and starts to go up again. When found at a support level, price may stop at that level and start to rise from there, while when it reaches a resistance area, it may slow down and turn bearish. In essence, areas of support support an asset's price while those of resistance resist its price.
These key areas, support and resistance, are frequented by the sellers and buyers because they can affect the price greatly. Buyers first search for the support area, willing to take a risk if a price rises above them. They know that the stock has difficulty breaking this area in the past. Sellers head to the resistance level to profit if the price decreases from it; they've experienced in previous meetings with other traders that it can happen here.
In their own words "support and resistance are important areas in the market as they serve as entries and exits point in he market."
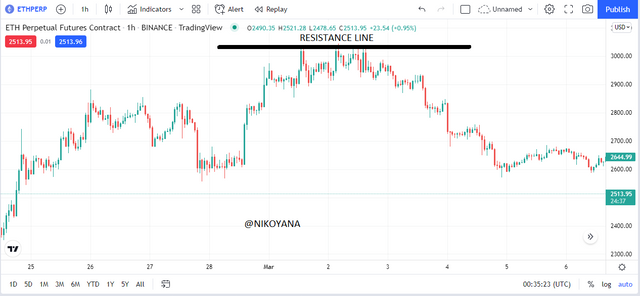
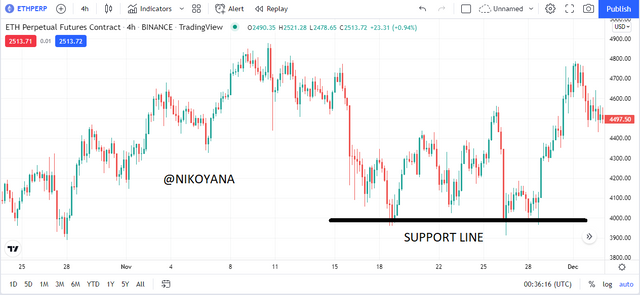
From the charts above, we can see the support and resistance line carefully drawn in which the price does not exceed those regions. this is very important as they may be of great use to buyers and sellers for entry and exit respectively.
there are basically 3 types of support and resistance which I will be listing and explaining below
Horizontal support and resistance
Understanding and following the tried and true horizontal support and resistance dynamic is helpful when beginning in the crypto market. It's when price pauses between buyer-defined targets or value assessment of a particular coin, which typically forms as a result of market softening or demand manipulation. These support and resistance points generally offer exceptional levels of stability, meaning it should be considered an area to accumulate tokens during dips.
Resistance can turn to support, and support can turn to resistance. A pivotal point is when this type of shift shares a space with contracting series of buy-sell ratios.
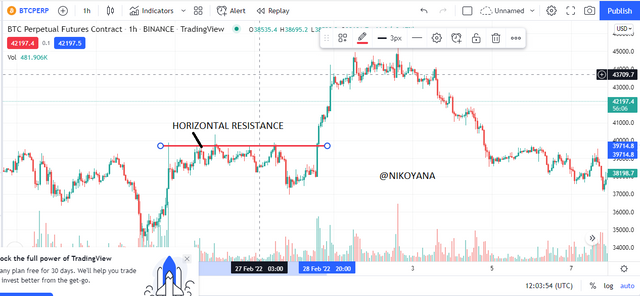
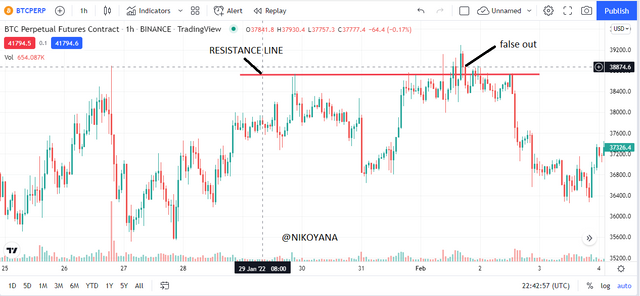
from the screenshot below, we can see that the horizontal line acts as a resistance to the price in which the price finds it hard to rise above that level at a certain period
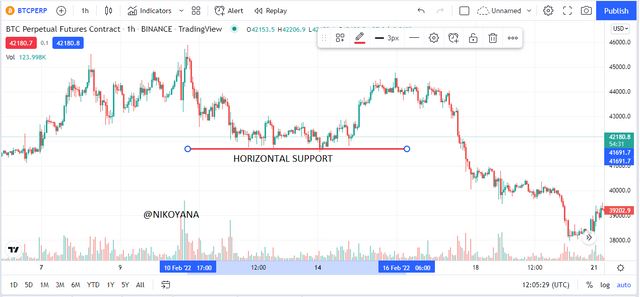
from the screenshot below, we can see that the horizontal line acts as a support to the price in which the price finds it hard to fall below that level at a certain period
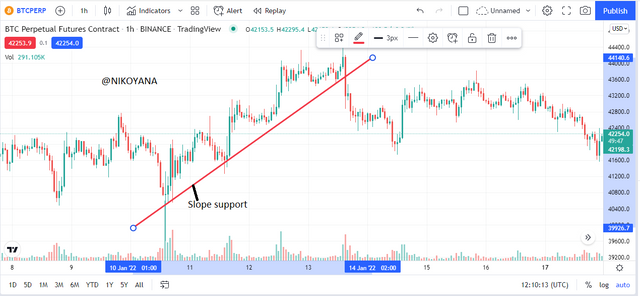
Sloping of support and resistance
Sloping levels of support and resistance are another type of trading strategy based on trend. These are also used to predict the future movement of prices, although they can be affected by a ranging market. Horizontal lines which cut across the slope (i.e., if there is a trending market, they cross before and after the line) serve as key inputs, while those that lie below it serve as resistance.
A support level is met when a market is trending in an upside direction. During an uptrend, the price will make higher highs and higher lows. Higher lows are retraced attempts as sellers take control for a short period of time before buyers resume the trend.
Support for the price is higher lows that act as the support during an uptrend. The higher lows support and rally the price to the upside each time it touches this area. To draw support correctly during an uptrend, three touches of higher lows must be identified and connected together.
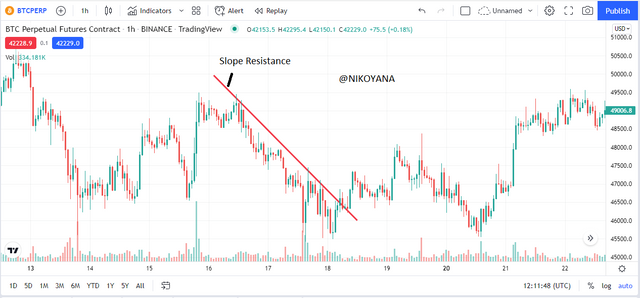
To identify resistance levels, the market must be trending in a downswing. A downtrend will show lower highs and lower lows. Lower highs are retracements that happen when buyers temporarily take over the market before being taken back by sellers.
resistance for the price is lower highs that act as the resistance during a downtrend. The lower highs resistance and rally the price to the downside each time it touches this area. To draw resistance correctly during a downtrend, three touches of lower highs must be identified and connected together.
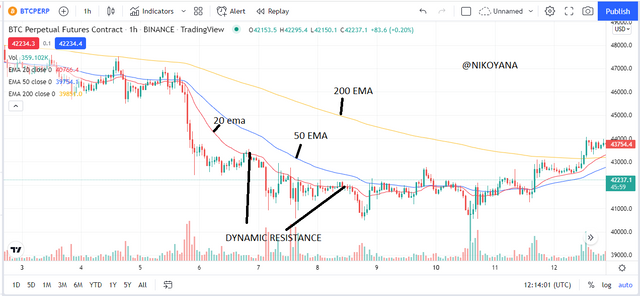
Dynamic support and resistance
Dynamic support and resistance prices consist of the converging of three moving averages on a chart. This is another way that traders predict the direction of price.
Traders can use indicators such as the 20, 50 and 200 moving average to analyze price movement. In the screenshot below: I have added these three moving averages to this chart. Any relevant moving averages can be added to help with your trading strategy.
The short EMAs 20 and 50 moving averages are a trader signals for an impending change in the market. When the price crosses 200 MA, it is a signal that there may be reversal.
Successful Breakouts
In order for an asset price to break the resistance/support zone, these zones have to have major selling/buying percentages. False breakouts typically occur when the price is hovering around the support/resistance level, and buys or sellers lose interest.
There is always the possibility for a breakout to be successful or false. This can happen when the price of a security breaks the support zone and goes in a downtrend trend in such a way that the support that's been broken becomes the new resistance. The same applies for breakout against resistance. If this happens, it is called as successful breakouts.
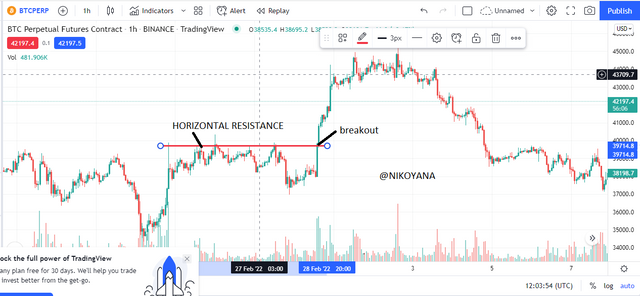
From the chart above, we can see the resistance broken and now acts as a support zone. Traders can make a buy order and take advantage of the strategy
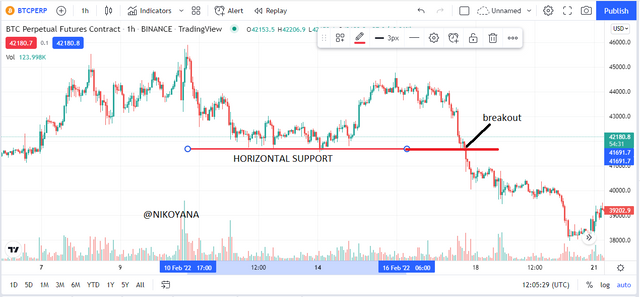
From the chart above, we can see the support broken and now acts as a resistance zone. Traders can make a sell order and take advantage of the strategy
False breakouts
In order to deceive retail traders, institution traders will want false breakouts at support as well. When the price breaks below the resistance zone, then comes back and rallies back up to above such resistance, the breakout becomes just a temporary pause.
Institutions and Whales are always backing a false resistance. They'll want to deceptively lure traders into the higher priced area with promises of purchasing an asset there only for it to quickly turn back into the lower priced zone.
I am going to be using volume and RSI to try and identify entry points in the market. RSI is one of the most popular indicators traders use, which shows when the price has gone overbought or oversold. When it's above 70 degrees on a 0-100 scale, it means that the price is currently overbought, and may still be headed downward. If we are to see an RSI reading of 30 degrees on that same scale, it is being oversold by sellers.
Volume indicators are one of the most important and useful indicators in the field of technical analysis. They show the volume in market transactions. I’ve combined these indicators with breakout analysis to identify a trading opportunity. Volume decreases could signal that buyers are retreating from an overpriced stock or as general deflationary concern. On the other hand, heavy volume purchases can signify that new buyers have entered the market or there is widespread speculation about some commodity or currency.
This is how the resistance and support strategy works. Firstly we will identify certain levels of support and resistance on the chart. These are very important. Then, we will add RSI and volume indicators to the chart. Now, after identifying these key support and resistance levels, we'll wait for a breakout in any direction depending on where the price follows.
If a breakout of the resistance occurs, and the RSI is seen cross the 50 scale above, and the volume increases significantly, then investors might deem it necessary to buy in.
Likewise, If a breakout of the support occurs, and the RSI is seen cross the 50 scale below, and the volume decreases significantly, then investors might deem it necessary to sell in.
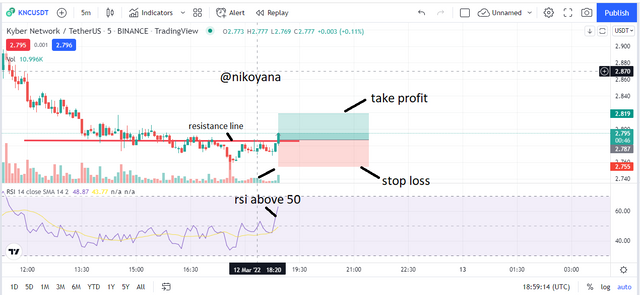
look at the example below

From the chart above, we can see that the price made a breakout from the resistance line as marked out above. Also in correspondence we can see the volume is high and the RSI is above 50. so we can place our trade for a buy at a 1:2 RRR stop loss and take profit.
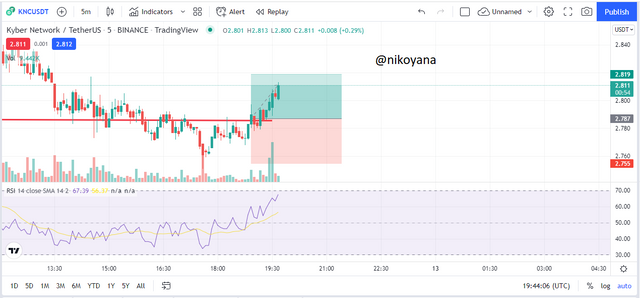
To carry out this trade, I will be using the chart of KNC/USDT chart. from the chart we can see the resistance marked out on the chart showing that there is not enough buying pressure to push the price upwards.
then I noticed the RSI was above 50 and the volume was increasing immediately, I rushed to my binance app to place a trade for a buy position.
I placed the trade of the KNC/USDT on the binance at a 20x with an entry price of 2.786 as we can se below it has already started generating profit.
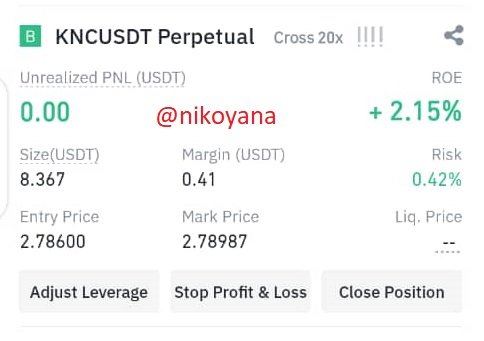
below is the chart of the running trade, I would let it run so I could maximize much profit from it
In a high volatility market, it can be difficult to accomplish trading goals such as identifying support and resistance. This is because of the limitations in the crypto industry which cannot be fully managed. Additionally, crypto traders rely on many other factors that can affect movement of price.
False breakouts occur in the market because price movements fail or are unable to continue a certain trend where price movements will reverse in the opposite direction of the trend. Below are some of the contributors to this phenomenon according to finance industry professionals:
Trading around support and resistance cannot happen without caution. Some false breakouts are induced by the whales or the big investors to catch mom-and-pop traders in a bind - so it's important to filter signals before taking the trade. which is one of the limitations as they can not work sufficiently alone.
In trading, it is an important idea to know when and what support and resistance are. They can help traders make entries and exits with the right strategies. For instance, if a stop loss limit is too close to profit level, there's increased risk. Often taking more risk than putting more profit might lead to losses.
Support and resistance are the basis of other popular technical trading strategies, with an identify of key areas before trading being important.
We have three types of support and resistance. Horizontal or static support and resistance tends to be more common in the beginning stages. Sloper support and resistance types are most useful for when a market is trending, either up or down. Lastly, dynamic support and resistance is often referred to as the "true secret" to trading after John Bollinger developed it in the 1980s - but still has many traders working hard to fully understand it inside and out.
Technical indicators such as the RSI, volume, and MACD can be combined with support and resistance for enhanced analysis and prediction.
IMAGE REFERENCE: Tradingview.com and binance