Bichi Indicative Strategy- Steemit Crypto Academy- S5W6-Homework post for @utsavsaxena11
There may be little errors due to google translate but I will try to make it minimal to the best I can, let's dive.


Give a detailed analysis of BICHI STRATEGY. Staring from introduction, identification of trends, trend reversal in market, entry and exit from the market, one demo trade and finally your opinion about this strategy. (Screenshot required). [4 points]

BICHI STRATEGY is a blue-chip equity strategy with a focus on quality over long-term performance. Master the minimization of risk, scaling in and out of trades, all while investing for the long term.
In general, traders base their custom trading strategy on what is most appealing to them. Many traders choose to use indicators such as MACD + RSI, BB + Volume and many more. BICHI is a specific type of trading strategy
ABOUT THE STRATEGY OF BICHI
“Bichi” is a Japanese word. It means “indicative strategy.” The strategy alerts traders when it’s time to buy or sell an asset by taking into consideration the Bollinger Bands and Ichimoku Cloud Indicators.
Popular technical trader tools like Bollinger Bands and Ichimoku Cloud can be combined to form the Bichi Indicative Strategy. The strategy relies on Momentum in the Market, as well as the ability of the market to reach this Momentum. This balance allows traders to adjust their actions accordingly.
This strategy is a complex system that involves many different components. Knowledge of these pieces is critical to being successful with the overarching BICHI strategy

How to use bichi strategy to identify uptrend market
Here, I'll be using TradingView to demonstrate the strategy. First place both the BB and Ichimoku Indicators on your chart of choice, then fill in any necessary settings on the Indicator Methods tab.
This is called the Bichi Indicative strategy and it judges how far a price might move. First you see if the market is moving up or down, and then whether the price breaks through the cloud or falls underneath it.
In a bichi indicative strategy, the basis line is the level the moving average was at before the beginning of a price structure. We use Price Action fields to measure when an uptrend moves up from below this baseline. if the basis line acts as a support and the price action breaks the ichimoku cloud upwards and continues in that direction, we can say it is an uptrend
Here, we need to wait for confirmation from BB and Ichimoku before initiating any trading strategy. Patience is needed for this strategy
let's look at the chart below for better explanation
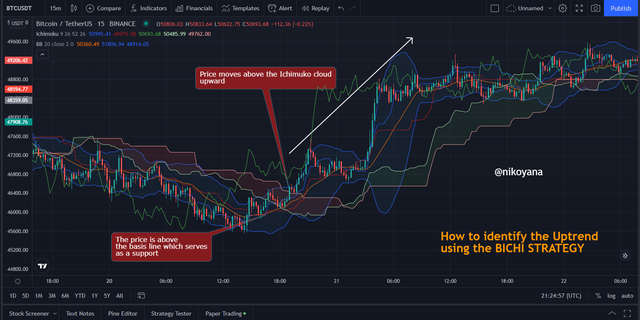
from the BTC/USDT chart above on a 15minutes time frame, we can see the basis line of the bollinger band is acting as a support, then I waited for the price to break the ichimoku upwards. so since the price breaks the ichimoku upwards and the price is also above the basis line which serves as a support, we can say it's an upward trend.

How to use bichi strategy to identify downtrend market
When taking decisive action in the market, it's important to have a pullback plan. If Price Action falls below the Baseline and the basis line acts as a resistance with the price action navigating its way down, then the downturn has started.
We use Price Action fields to measure when a downtrend moves below the basis line. if the basis line acts as a resistance and the price action breaks the ichimoku cloud downwards and continues in that direction, we can say it is a downward trend
With bichi indicative strategy, you can hold your position until there is confirmation from BB and Ichimoku. patience is really needed.
let's look at the chart below
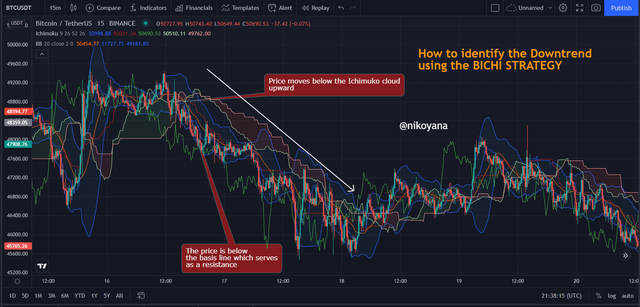
from the BTC/USDT chart above on a 15minutes time frame, we can see the basis line of the bollinger band is acting as a resistance, then I waited for the price to break the ichimoku downwards. so since the price breaks the ichimoku downwards and the price is also below the basis line which serves as a resistance, we can say it's a downwards trend.

How to use bichi strategy to identify Trend Reversal market
A trend reversal is a change in the price movement from up to down or vice versa. We know this because a trend reversal changes the present movement.
What you need to know about identifying a reversal
When the price of an asset moves below and above the baseline multiple times, we consider it to be in a sideways market. In this situation, we recommend avoiding orders and waiting for a signal to help understand what direction the asset will move.
With Bichi, it is possible to identify trend reversals before they happen. When we see the Sideway market, sooner or later Price Action begin moving above the Baseline and break the cloud, signalling trend reversals before they happen allowing for users to either continue growing their positions or manage their long positions by cost averaging.
let's look at the image below
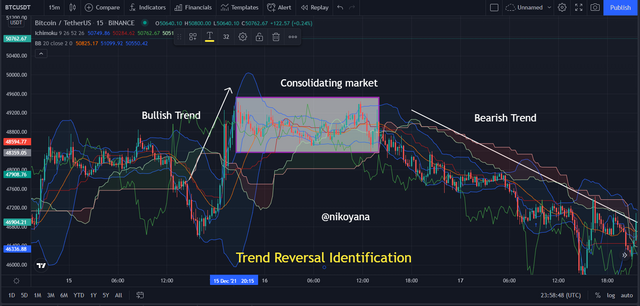
From the BTC/USDT chart on a 15mins time frame, we can the price action started on a bullish trend, then we waited for the price to move in a sideways direction creating series of highs and lows in the same range which I called a consolidating market. This tells us that a market’s next move will be in an opposite direction showing that there is a struggle between buyers and sellers and the price can no longer push upwards.
from the chart we can see that the price action broke the ichimoku cloud many times going through the sideways movement which was seen after the bollinger bands gives it's confirmation that the price can no longer push upward and there is a reversal.
this strategy is used for both a bullish or a bearish reversal.

Entry and Exit Order with BICHI Strategy
LET'S START WITH A BUY ORDER
bichi has an indicative strategy to show you when a stock is favorable for purchase by using the basis line of the bollinger band as a support for signal towards trade. Then use the Ichimoku Cloud as confirmation of the trade as it tells whether your investment is still favorable.
With the Ichimoku Cloud confirming the trend, place orders for your trade in the upcoming price.
For a buy order, the price must be above the bollinger band and the ichimoku cloud
It is based on these indicators and depends on the rules above. When conditions are met, some profitable buy deals are executed according to this strategy. let's see the chart below
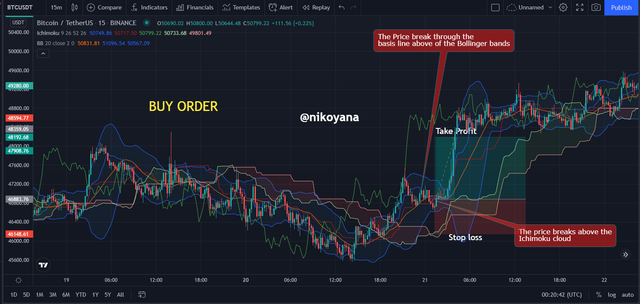
from the BTC/USDT chart on a 15minutes time frame , we can see that the price breaks through the bollinger band upwards and also through the ichimoku cloud upwards.
I set my stop loss and take profit at a 1:2 RRR to maximize a buy perfect trade condition.
FOR A SELL ORDER
For a sell order the bichi has an indicative strategy to show you when a stock is favorable for purchase by using the basis line of the bollinger as a resistance for signal towards trade. Then use the Ichimoku Cloud as confirmation of the trade as it tells whether your investment is still favorable.
With the Ichimoku Cloud confirming the trend, place orders for your trade in the upcoming price.
For a sell order, the price must be below the bollinger band and the ichimoku cloud
It is based on these indicators and depends on the rules above. When conditions are met, some profitable sell deals are executed according to this strategy. let's see the chart below
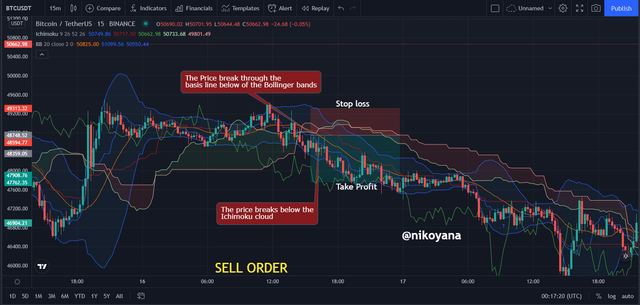
from the BTC/USDT chart on a 15minutes time frame , we can see that the price breaks through the bollinger band downwards and also through the ichimoku cloud downwards.
I set my stop loss and take profit at a 1:1 RRR to maximize a sell perfect trade condition.

MAKING A Demo trade with BICHI Strategy
For the demo trade I will be using a chart of BTC/USDT on a 1minute time frame for a buy order. we can see the conditions of a buy order being met. the price of the asset is above the basis line of the bollinger band and the price also breaks through the ichimoku cloud upwards.
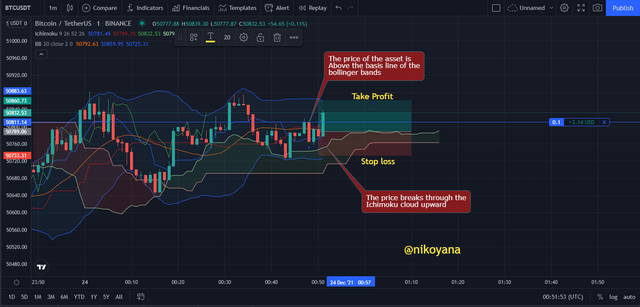
I placed my stop loss and take profit at a 1:1 RRR to ensure a perfect buy order condition and placed my trade
The screenshot below shows my trade result from the buy order which I initiated.


MY OPINION ABOUT THE BICHI STRATEGY
By using the bichi strategy, inexperienced investors can garner quick, profitable trades. The strategy requires exploiting price gaps with an understanding of how companies value their stocks relative to their share prices.
This strategy is only recommended for short time frames because it doesn't last well for long time frames. it also requires great observation and patient skills.
The bichi approach eliminates false signals to give you real, profitable trading indicators. The BB indicator components includes Bollinger Bands and the Ichimoku cloud.
Some newbies may not use the bichi indicator as an accurate forecasting. Depending on how it is used, bichi can some times be inaccurate or misleading for those new to the system.
With ichimoku charting, there are many possible trades you can do - but with bollinger band charting, you will understand it quickly. It will be great to learn both indicators individually before applying them both.

2. Define briefly Crypto IDX and Altcoins IDX. What is signal prediction trading. Is it legal or ill-legal in your country.

CRPTO IDX
Crypto IDX means an asset, which is made up of the combination of four cryptocurrencies like Bitcoin, Litecoin, Ethereum, and Zcash. The crypto index uses market price that includes both supply and demand in the market. The crypto IDX is not available on any other cryptocurrency platform other than Binomo.
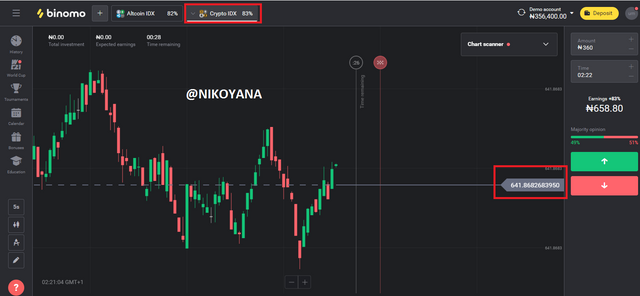
The screenshot uploaded above is the chart of Crypto IDX, as indicated by a red box. The value displayed on the screenshot is an average of four different cryptocurrencies, which is calculated by software.
ALTCOINS
In the Crypto IDX model, top four cryptocurrencies are combined and work based on the average price of these combined four cryptocurrencies. In the other Altcoin IDX model, four altcoins are considered to create a parallel asset. Crypto IDX uses a combination of LiteCoin, Bitcoin, Ethereum and Monero while Altcoin IDX considers Ripple, Monachain, Stellar and Ethereum respectively.
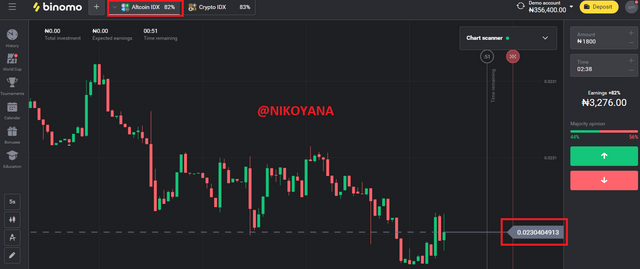
The photo of the price displayed, as indicated by a colored box in the screenshot, is above. It is showing that the average of four altcoins are over time.
Is signal prediction legal or ill-legal in my country (Nigeria)
Signal Prediction trading, widely known as price prediction, allows you to profit from short-term fluctuations in the value of an asset. This approach can be manual or done by software.
The crypto industry uses two types of tools for predictions on the future movement of cryptocurrency. The first type is manual signal prediction, which incorporates both fundamental analysis and technical tools like trendlines, indicators, and chat patterns to analyze data. The second type is software signal prediction. This method relies on software and algorithms built by professional analysts to prepare the trade quickly, putting more time into research than managing complicated models
The Nigerian Central Bank has given an order to all Nigerian Banks and Institutions not to transact with anyone in the cryptocurrency sector. The question here is, is crypto trading illegal in Nigeria? We do not think it's illegal for now.

3. If you want to create your own penny IDX, then which 4 penny assets will you choose and what what is the reason behind choosing those four assets. Define Penny currencies.(Explain, no screenshot required). [2points]

I will be making my own penny IDX with Chiliz, Steem, Harmany, and Dogecoin
CHILIZ
Chiliz has created an innovative form of contributing to your favorite sports teams. Partnering with Fortune 500 companies, they’ve created tokenized fan communities that allow fans to collect points for activities like voting for new games, updating club rosters, and other ways to interact with the sport. The better choices you make within their ecosystem, the more points you can accumulate. Sometimes up to 1 million Chiliz will be awarded yearly.

STEEM
Steem has had rapid success over the course of the last year. For instance, steem had low trading price in 2017, which increased to $1.79 on January 20th, 2018. Steem's many innovations are leading to this bullish trend continuing into 2022.

HARMONY
Harmony is a crypto currency with a native Harmony token that has many uses, including as a pay fee or sp for transactions. The price of the Etherum coin is $0.252 considering it part of my penny IDX is brilliant because of its potential for growth.

DOGECOIN
Dogecoin is a cryptocurrency consisting of memes. and has a beautiful prospect with great promotion strategy. Dogecoin's price is updated in real time, and the current price is $0.1897.


CONCLUSION
BICHI Indicative strategy is a combination of Bollinger band and ichimoku cloud indicators to make strategic market analysis. This strategy does require patience and understanding for those who use it.
In this post we reviewed the bichi indicative strategy and how to use it on charts for trend and reversal patterns
This crypto analysis uses strategies to show results in both IDXs which is the Crypto IDX and the Altcoin IDX, with a Penny explanation. in all it was a beautiful experience thanks to Professor @utsavsaxena11

IMAGE REFERENCE
coinmarketcap
tradingview
binomo