Basics to trade cryptocurrencies correctly. | Part 2 - Crypto Academy / S6W3 - Homework post for nane15.
This lecture educates us about the basics for trading cryptocurrency correctly and it was excellently delivered with eloquence and I have also read and understood the lecture nd will be expressing my thoughts below.
.jpg)

To have a basic understanding of trading, you need to consider the following things – the chart, candlesticks and timeframes. I’ll be going over these individually.
CHART
This graph is a visual representation of the number of buyers and sellers in the market. It also displays whether there are more purchasing or selling power in the asset at any given time. Charts are paired with each currency, such as LUNA/USD.
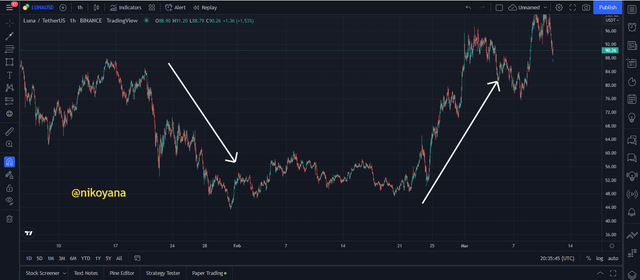
This is a market chart. The the buyers are greens and the sellers are red, likewise, the green arrows represent a rise in the market. The red arrows indicate a decrease in the market. So it is easier for us to see what is happening on a market chart.
CANDLESTICK
The candlesticks provide the user instant knowledge of what buyers and sellers are feeling about that particular time frame. Green means high buyers in the market, red means high sellers in the market.
When you see green at the top of a candle, it indicates more buyers in the market. Red at the top generally means more sellers in the market.
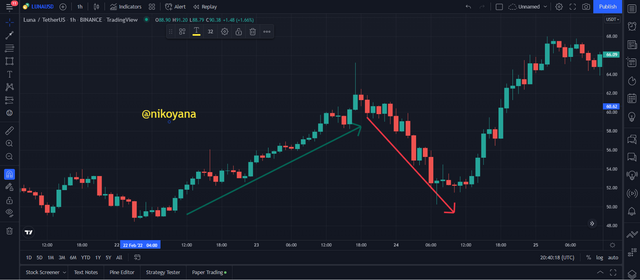
we can see that the arrows marked with green shows a rise in the price of an asset indicating that there are more buyers and the arrow marked with red indicating that there are more sellers.
TIMEFRAME
Different types of timeframes are used to trade or place trades in different intervals. A day timeframe will show certain moods, while a 5-minute timeframe will better depict the movement.
When the time frame for RED or GREEN is shown, it simply means that there are more greens than reds at that point or vice versa and not just that only greens or reds exist at the moment. When we see different shades of green, it implies that there is an equal number of buyers at that point.
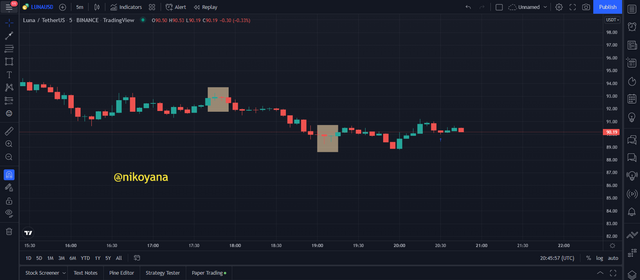
let's look at the time frame at 5mins and 1 min
Carefully look at the box being marked out below to show that there is a pressure from the buyers as well as the sellers. to explain my point above better, I will be expanding the chart into a 1 min time frame and we would notice that not just buying or selling interactions went on at the marked surface but even imbedded in the green candlestick, there are still sellers interacting just that the buyers tend to be more
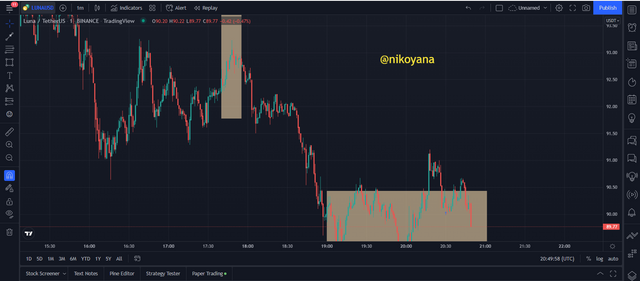
From the 1 min chart we can still see the marked out areas and we can attest to see that there are a lot of interactions going on, you just need the right time frame to place your trade.
Identifying support and resistance levels can help crypto traders to know what to expect in the next market behavior. Because the market always repeats itself, identifying these levels will tell traders when to anticipate a possible change.
Supports and resistances are points at which the market begins to rise or fall. Breaking these points signals a possible breakout, in which new trends can be expected to occur.
Let's consider the charts below to see how to mark out our support and resistance level
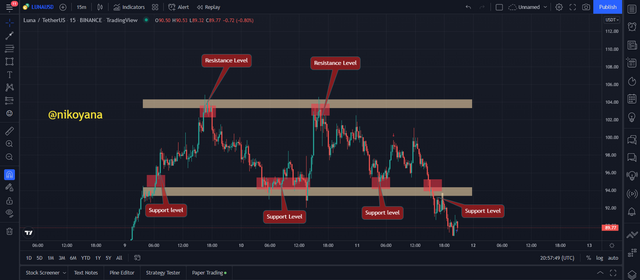
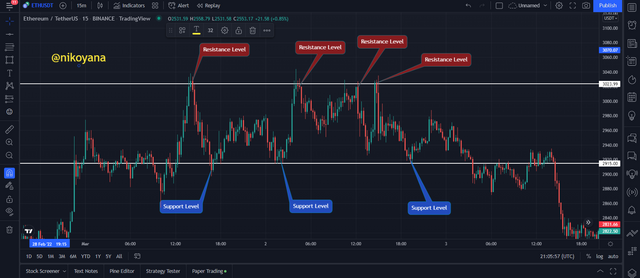
From the LUNA/USDT and ETH/USDT chart above, we can see the support and resistance level marked out showing areas where the buying pressure couldn't exceed and areas where the selling pressure couldn't exceed
In order to identify this points, zoom out of the chart to be able to see the longer time frames then mark out at most 2 - 3 points where the buying pressure or selling pressure couln't exceed then draw a line across them.
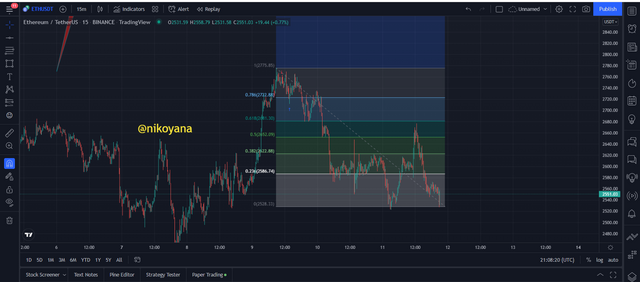
Fibonacci Retracement
When looking to place a trade, traders may be able to use Fibonacci retracements as guidelines for where the market is likely to reverse. The way the Fibonacci calculation is used depends on whether the asset is in impulsive or corrective phases. In an uptrend, traders will wait for the market to retrace back down to previous support levels; in a downtrend, they'll wait for it to retrace back up through previous resistance levels. Traders can use these retracement points as indicators of where they should place their trades, such that they catch the bounce and are not blindsided by unfavorable movements.
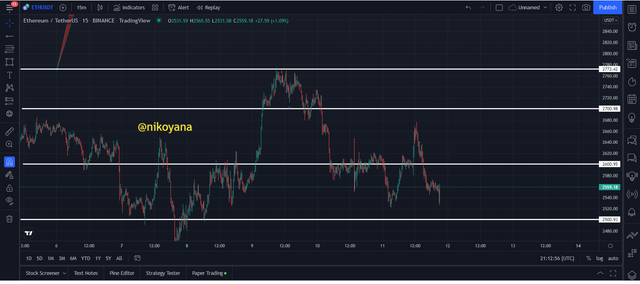
When the market reaches a round number, its price can change significantly. For example, when the market hits 2700 points, 2500 points or any significant round number, we might see a different movement in the market because some will wait for it to reach that point before making a purchase.
ACCUMULATION and DISTRIBUTION
To buy or sell, you should observe what the powerful hands are doing because their decision push markets in a direction. You should trade along with them to make money. which means observing two important stages which are the accumulation and distribution zone.
In this market, the strong will prey on the weak by liquidating their position and allowing them to trade low. We can then make a move once again to a new high after they sell. In this situation, we should sell when they sell at distribution points which by then profit has been made
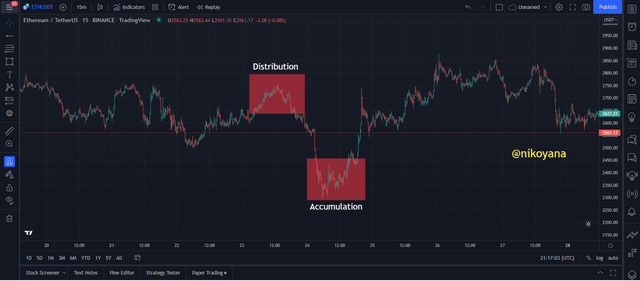
From the chart above we can vividly see the accumulation and distribution stages of the market.
Your understanding of the levels of support and resistance can help you take advantage of the market when those levels are broken. If an asset breaks its previous high, it will most likely bounce back up to its previous level.
Based on the graph below, when the market goes to its original high and it refuses to return, instead, breaking the resistance, and continues fluctuating turning the new resistance into a support with the price action bouncing on the new support to make a reversal. use that as a sign to buy with a stop loss at the previous resistance or new support level.
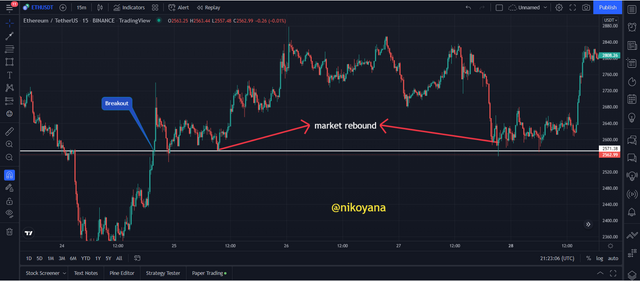
The rebound is when the market bounces back to its previous lows. The rebound strategy can be used to our advantage, because the market is going to continue up, in this case.
Likewise for a breakout, as we can still see in the chart where the price action cuts across the resistance with a high volume going upward showing that the buying pressure has exceeded that point.
A false breakout occurs when the price of a security moves beyond an old support or resistance point without sustaining that movement. A false bullish breakout is when the price rises to easily clear the old resistance level but then fails to move higher.
When the market seems to be breaking out, but then retracts and decreases back to lower levels that could indicate a false breakout.
When the price crosses below a low point, but immediately rebounds without going any lower, this is known as a false bearish breakout. The price will typically narrow and then bounce back up. This demonstrates that there is buying pressure around the support level in order to counteract the breakout.
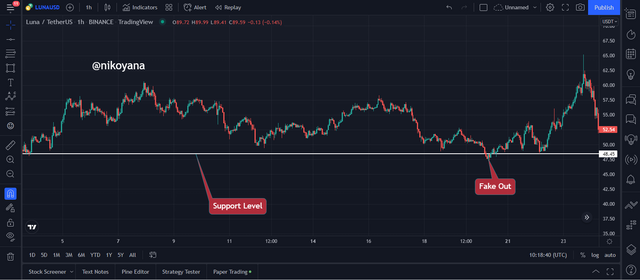
The image above is showing a false breakout. The trader would want to know if the market is trending up before deciding to buy, since in this case there was a brief uptrend which resulted in a market downtrend.
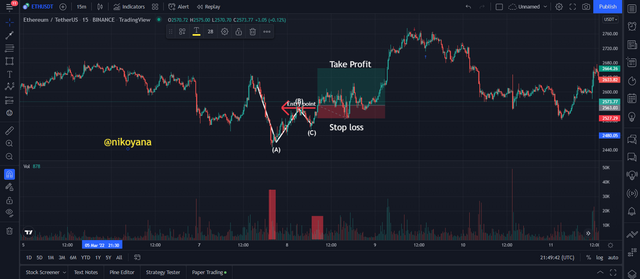
Trend trading is using the trends in a given market to produce a favorable outcome. In the Elliot Theory, we buy after seeing a retrenchment at the corrective line which is greater than the previous high, and we see volume increase upon completion.
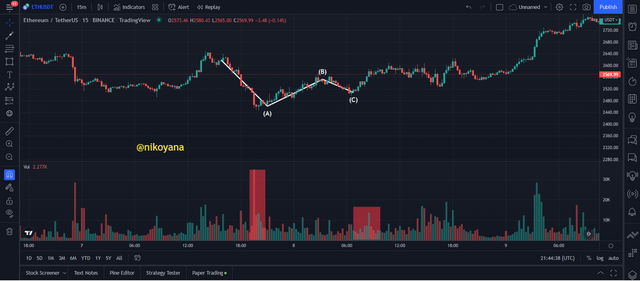
The price of the chart was bullish, as it was pushed back each time. This indicated that more buyers than sellers were present in the market. The volume indicator is represented by the colored bars below each time. More bearish candles are on the chart.
After observing the market, we notice that the price has broken momentum to go against direction of the Elliot wave and we decide to buy there. At this point, the stop-loss should be placed at an earlier low and the strategies target is set at a 1:2 RRR.
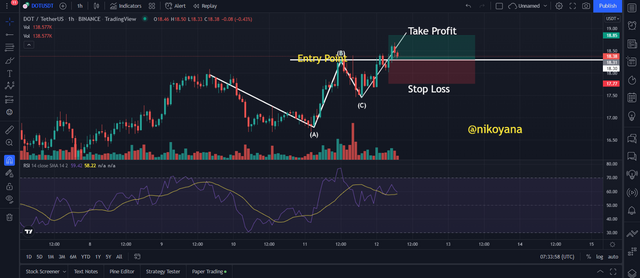
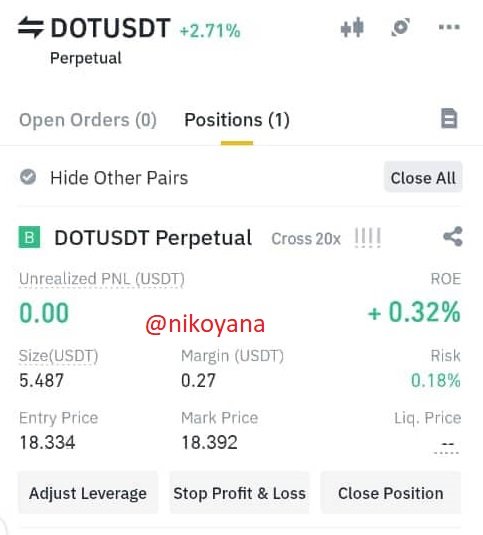
I will be using the Elliot retracement method on the market of DOTUSDT, in this case, I witnessed a bullish trend. I was able to identify the corrective line c when the market breaks it that I have my entry.
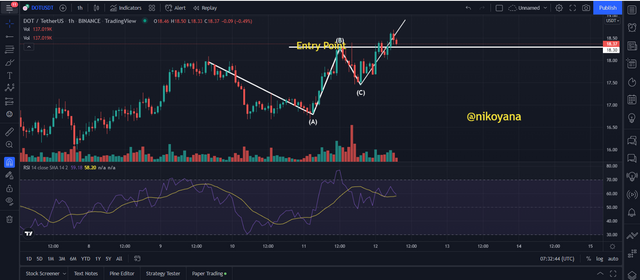
Originally I placed my stop loss below the corrective line c. I set my risk-reward ration to be 1:1, and noticed that the RSI indicator had reached the upper region. Considering this to be a good opportunity for a buy.
then I went straight to my binance, the image below is an image of my verified binance account
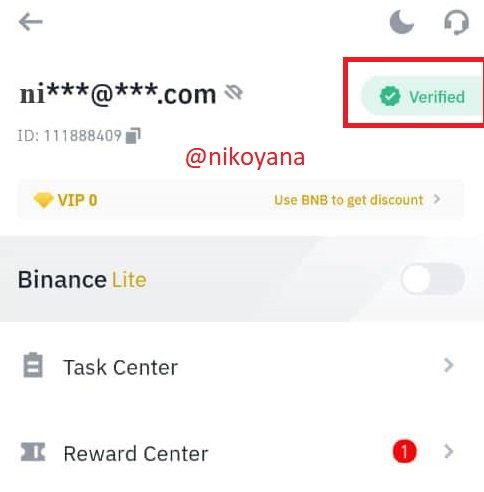
I think I'll buy some DOT/USDT futures on the market. I'll put in a buy order for 20X leverage, then I'll take my profit. I entered the trade at 18.33 as we can see and made a 0.32% profit.
This post summarizes the basics of trading cryptocurrencies, including understanding market movement and predicting trends.
Identifying support and resistance is important for traders because it can help them identify the trend and also identify a perfect entry and exit position.
The Fibonacci retracement is a tool that can be used to anticipate the market’s next reaction. The price tends to repeatedly bounce between support and resistance levels with periodic fluctuations.
thank you all for reading my post.
best regards
@nane15